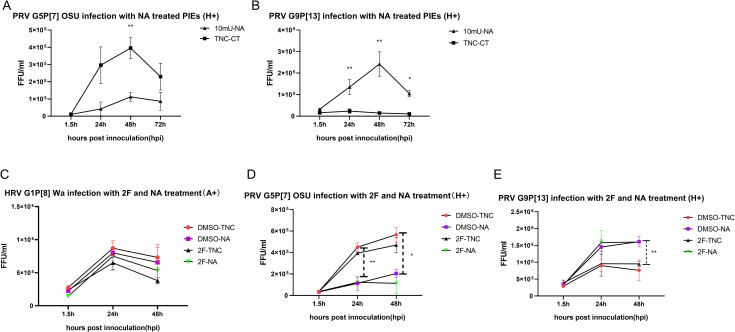
Fig 8. Sialidase and 2F double treatment on tested RV strains.
Growth curves of A) OSU and B) G9P[13] in H+ PIEs treated with sialidase, respectively. PIEs were pre-treated with 10mU sialidase (10mU-NA) or TNC buffer (TNC-CT) for 1h at 37°C before inoculation. Then, PIEs were inoculated with RVs (MOI = 0.5) for 1.5h at 37°C. Plates were harvest at 1.5hpi, 24hpi, 48hpi, 72hpi and the virus growth were measured by RT-PCR. Growth curves of C) Wa, D) OSU and E) G9P[13] in A+ or H+ PIEs treated with sialidase and 2F. 500 μM of 2F or DMSO was added to differentiated PIEs for 3 days (the medium was replaced and 2F or DMSO were added daily). PIEs were then treated with 10mU-NA on the infection day followed by RV infection (MOI = 0.5). PIEs were re-plated into 3 96-well plates and harvested at 1.5hpi, 24hpi, 48hpi and the virus growth were measured by RT-PCR. Four different treatment groups were: DMSO-TNC (control group, represent by red circle), DMSO-NA (sialidase single treatment, represent by purple square), 2F-TNC (2F single treatment, represent by black triangle), and 2F-NA (2F and sialidase double treatment, represent by green triangle). The error bar represents the standard deviation from triplicate samples. All infectivity assays have been repeated at least twice. For P value: * p<0.05, ** p<0.01, *** p<0.001.

