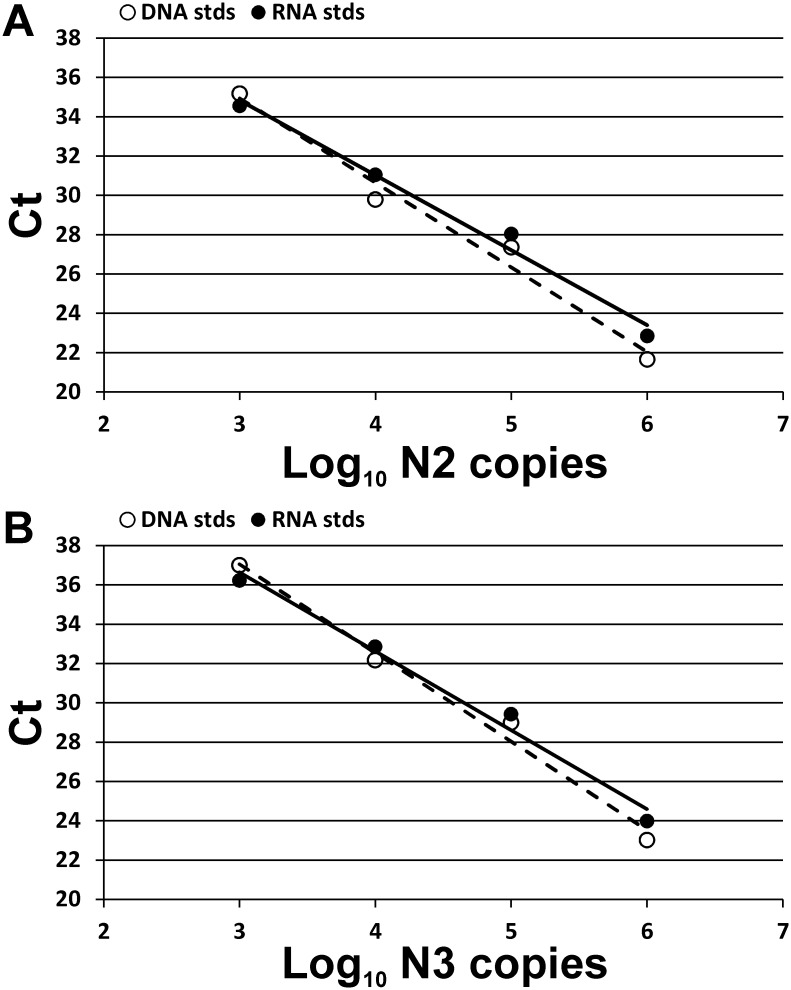
Fig 1. Standard curves used for calculating the SARS-CoV-2 RNA absolute number in swabs.
Two PCR systems for detection of the N2 (A) or N3 (B) regions of SARS-CoV-2 nucleocapsid (N) gene were used. The curves were generated using standard samples with either synthetic DNA fragments (white dots, dashed lines) or viral genomic RNA (black dots, solid lines). Both standards demonstrate similar results.

