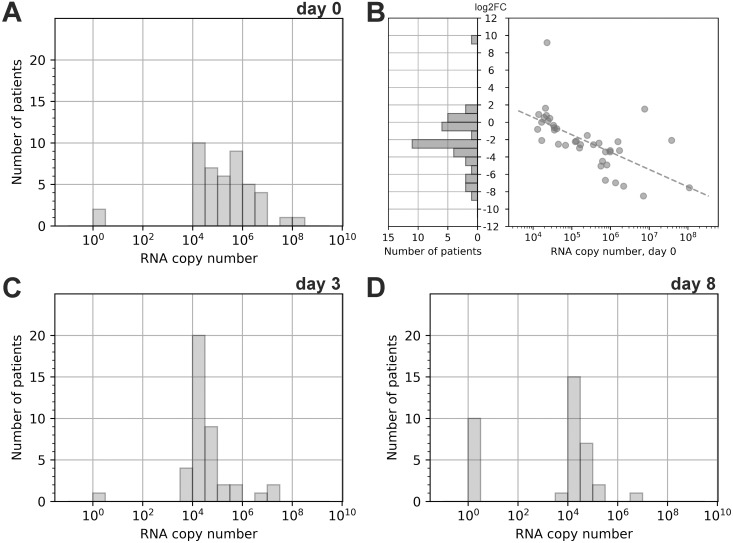
Fig 2. SARS-CoV-2 RNA quantity change dynamics.
The distribution of viral RNA load in the nasopharynx of patients at day 0 (A), day 3 (C), and day 8 (D). To use the logarithmic scale, the exact 0 was replaced with 1 (100). Distribution of log2 transformed fold change of RNA copy number between swabs on days 0 and 3 (B Left). Dependence between log2 transformed fold change of RNA copy number and RNA copy number on day 0; dashed line shows linear approximation of the trend (Spearman correlation, r = -0.7, p-value < 0.00001) (B Right). Only patients having non-zero values of RNA copy number on both day 0 and day 3 and were not hospitalized between days 0 and 3 are shown.

