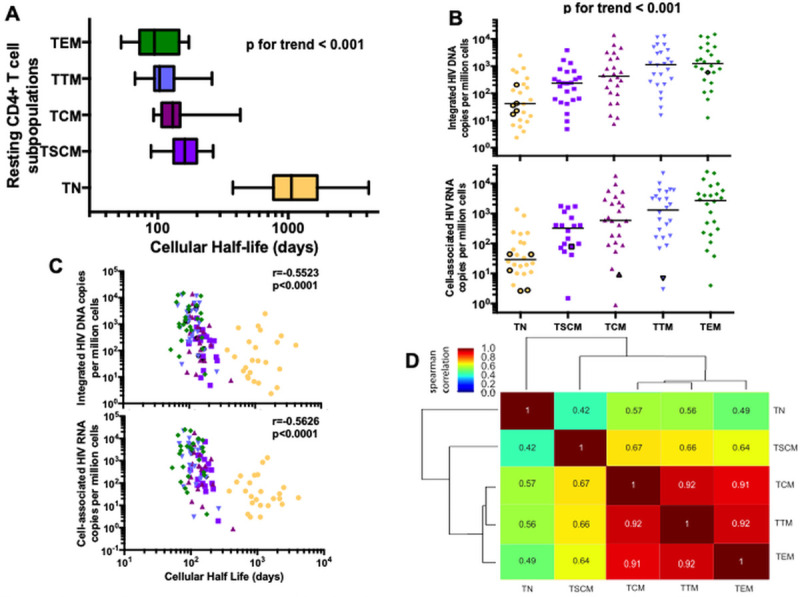
Fig 2. HIV is preferentially harbored in CD4 T cell subpopulations with relatively short half-lives.

HIV genome levels and cellular half-lives were measured in 24 HIV-infected participants within the following resting CD4 T cell subpopulations: naïve (TN, yellow circle), stem-cell memory (TSCM, purple square), central memory (TCM, pink upward triangle), transitional memory (TTM, blue downward triangle) and effector memory (TEM, green diamond) cells. Medians and interquartile ranges are represented, and only significant p values are shown. Undetectable values were assigned a value equal to the threshold of detection based on the number of cells analyzed. A. The cellular half-life for each sorted cell subpopulation is shown in days. A p value for trend was statistically assessed across all five subpopulations. B. Levels of integrated HIV DNA and cell-associated HIV RNA were measured and are presented on a log10 axis as copy number per million cells. Medians are represented and each symbol represents a single participant sample. Values under the level of detection of the assay are represented in a black circle. A p value for trend was statistically assessed across all five subpopulations. C. The relationship between HIV genomes and cellular half-lives is shown for all cells. Integrated HIV DNA and cell-associated HIV RNA were measured and presented as copy number per million CD4 T cells. Cellular half-lives are expressed in days. D. Hierarchical clustering based on Spearman correlations among integrated HIV DNA frequency in each cell subpopulation.
