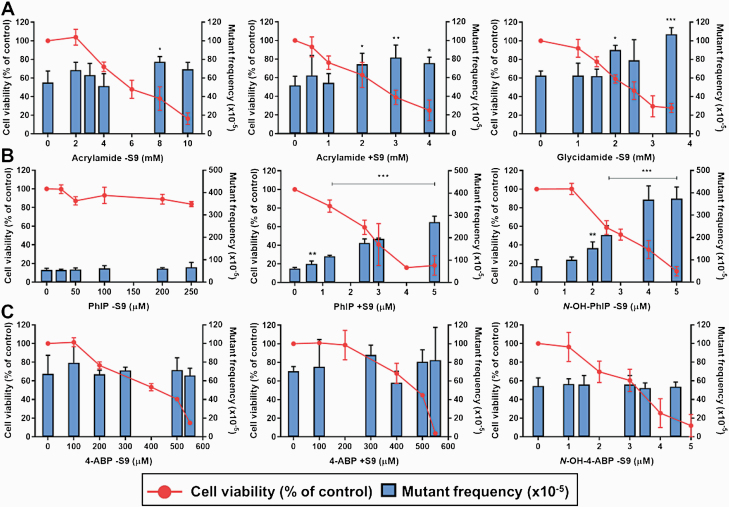
Fig. 3.
Induction of lacZ mutant frequency in FE1 cells. Cells were treated as indicated with acrylamide ±S9 or glycidamide −S9 (A), PhIP ±S9 or N-OH-PhIP −S9 (B) and 4-ABP ±S9 or N-OH-4-ABP −S9 (C) for 6 h followed by a 72-h sampling period. Control cells were treated with water (A) or DMSO (B and C) only. The lacZ mutant frequencies were calculated as the number of lacZ mutants per total number of recovered lacZ copies. Statistical analysis was performed in SAS v.9.1 using Poisson regression values (*P < 0.05; **P < 0.01; ***P < 0.001 compared with control). Values shown are the means of three replicate experiments + SD.

