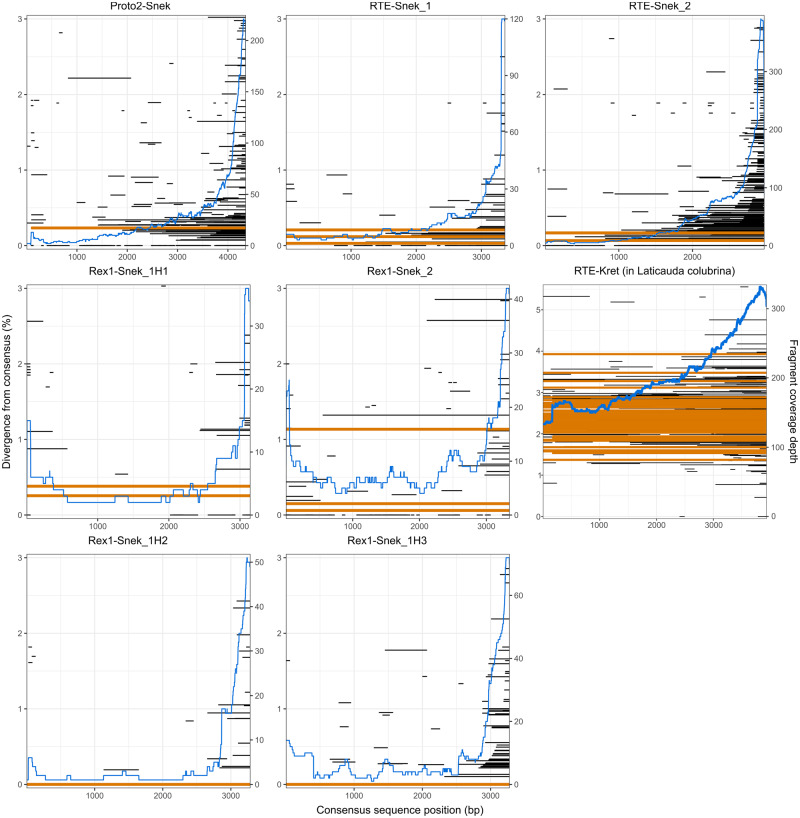
Fig. 2.
Coverage and divergence from consensus of the seven horizontally transferred LINE subfamilies identified in the Aipysurus laevis genome and the one identified in Laticauda colubrina. LINE fragments were identified with BLASTN (Altschul et al. 1990; Camacho et al. 2009) and plotted using ggplot2 (Wickham 2011) using the consensus2genome script (https://github.com/clemgoub/consensus2genome, last accessed September 16, 2020). The blue line represents the depth of coverage of fragments aligned to the subfamily consensus sequence (shown on right-hand y axis). Each horizontal line represents the divergence of a fragment and its position mapped to the repeat consensus (position shown on x axis); orange shows full-length repeats and black shows repeat fragments. The divergence from consensus of the repeats is shown on the left-hand y axis.

