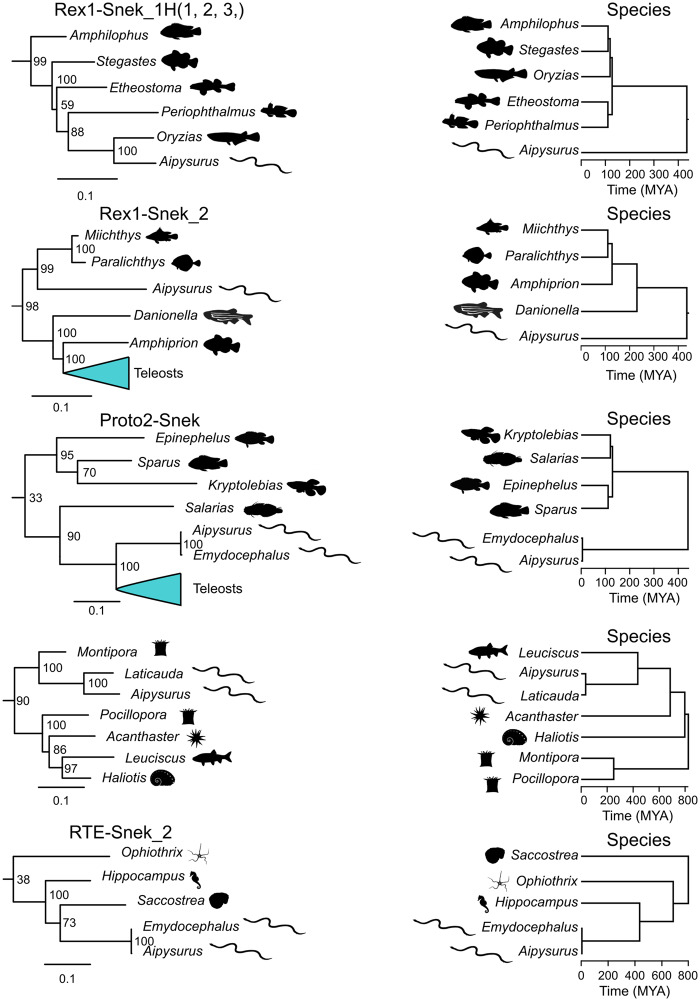
Fig. 5.
Excerpts from the phylogenies of all intact curated and Repbase RTEs and all intact curated and Repbase Rex1s compared with host species phylogeny. The blue triangles on the left represent condensed large subtrees of LINE sequences. TE phylogeny scale bar represents substitutions per site. The numbers next to each node in the repeat trees are the support value. Extracts from larger phylogenies constructed using RAxML (Stamatakis 2014) based on MAFFT (Katoh and Standley 2013) nucleotide alignments trimmed with Gblocks (Talavera and Castresana 2007) (for full phylogenies see supplementary Appendix, figs. S1 and S2, Supplementary material online). Species trees constructed with TimeTree (Hedges et al. 2006).

