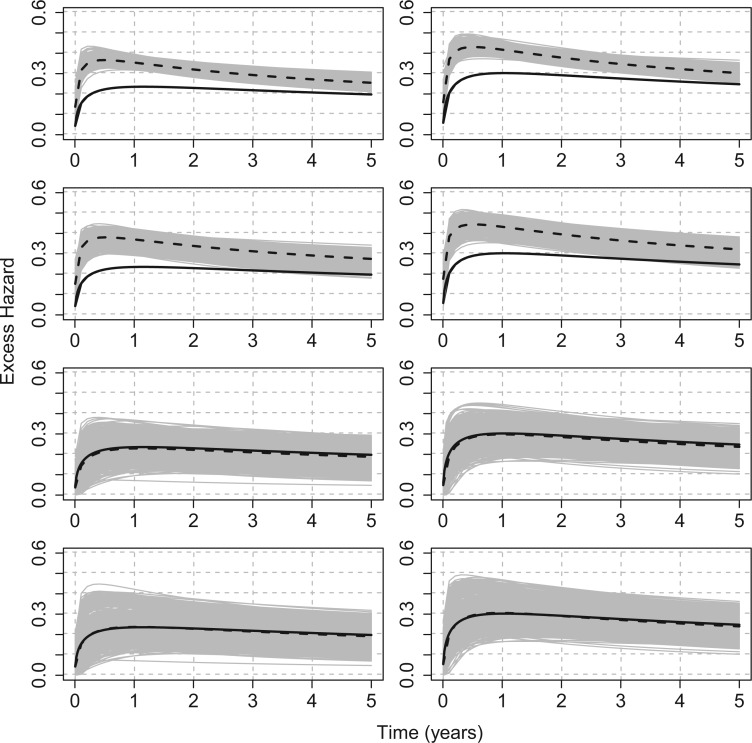
Fig. 2.
Scenario with wide mismatch:  . Models M1–M4 from top to bottom. Mean of the fitted excess hazards (dashed lines), compared to the true generating excess hazard (continuous lines), and 1000 sample-specific fitted excess hazards (grey lines) for
  and
and  censoring. Panels from left to right correspond to two sets of values for the covariates (age, sex, comorbidity) =
  , respectively. Design I:

