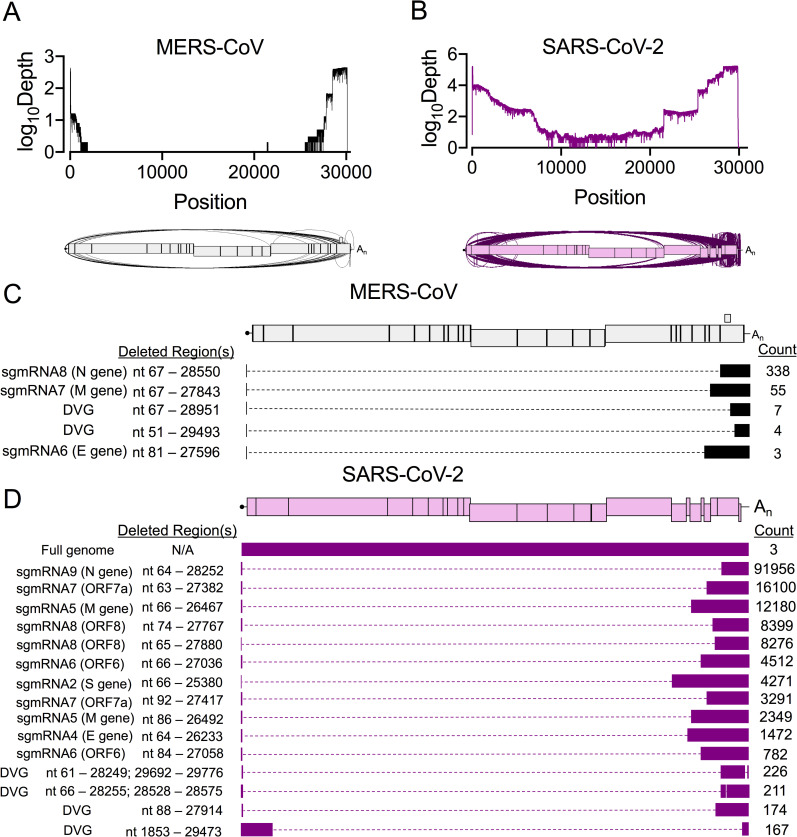
Fig 2. Direct RNA Nanopore sequencing of MERS-CoV and SARS-CoV-2 reveals accumulation of distinct recombined RNA populations.
Direct RNA Nanopore sequencing of poly-adenylated MERS-CoV and SARS-CoV-2 RNA. Three sequencing experiments were performed for each virus. Nanopore reads passing quality control were combined and mapped to the viral genome using minimap2 [70]. Genome coverage maps and Sashimi plots visualizing junctions (arcs) in full-length (A) MERS-CoV (black) and (B) SARS-CoV-2 (violet) RNA reads. (C) Distinct RNA molecules identified in MERS-CoV (black) with at least 3 supporting reads are visualized. The number of sequenced reads containing the junction is listed (Count). Genetic sequences of each RNA molecule are represented by filled boxes and deleted regions are noted (Deleted Region(s)) and represented by dashed lines. (D) The 15 most abundant SARS-CoV-2 (violet) recombined RNA molecules and 3 full-genome reads are visualized. See also S2 Table, S3 Table, S4 Table.

