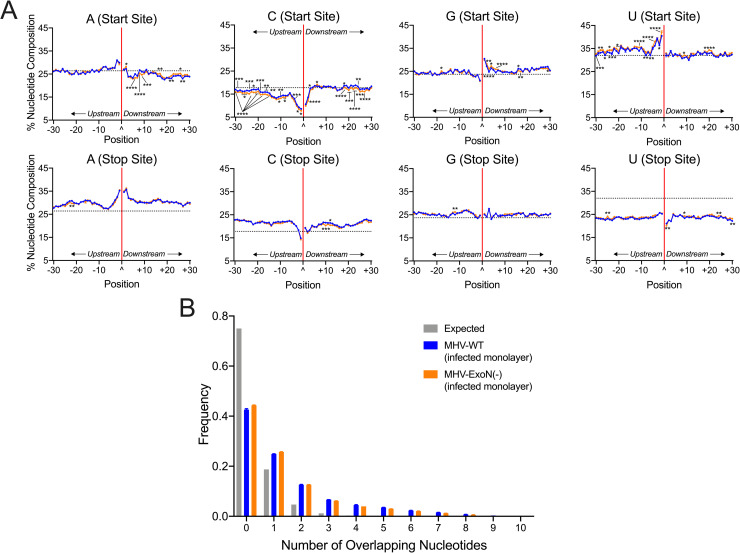
Fig 5. MHV-ExoN(-) DVG junction sites display both WT-like patterns of sequence composition and multiple alterations in nucleotide frequency, revealing microhomology at junctions.
(A) Nucleotide composition was calculated as the percent adenosine (A), cytosine (C), guanine (G), and uracil (U) at each position in a 30-base pair region flanking DVG junction start and stop sites in MHV-WT (blue) and MHV-ExoN(-) (orange) infected monolayer RNA. The junction is labelled as a carat (^) and a solid red line with upstream positions numbered -30 to -1 and downstream positions +1 to +30. The expected nucleotide percentage was calculated based on the overall MHV genome and represented as a dashed black line. Each point represents a mean (N = 3) and error bars represent SEM. 2-way ANOVA with multiple comparisons corrected for false discovery rate (FDR) by the Benjamini-Hochberg method. * q < 0.05, ** q < 0.01, *** q < 0.001, **** q < 0.0001. (B) Distribution of microhomology overlaps in MHV-WT (blue) and MHV-ExoN(-) (orange) compared to an expected probability distribution (gray). The frequency of each overlap length is displayed as a mean (N = 3) and error bars represent SEM. See also S5 Fig.

