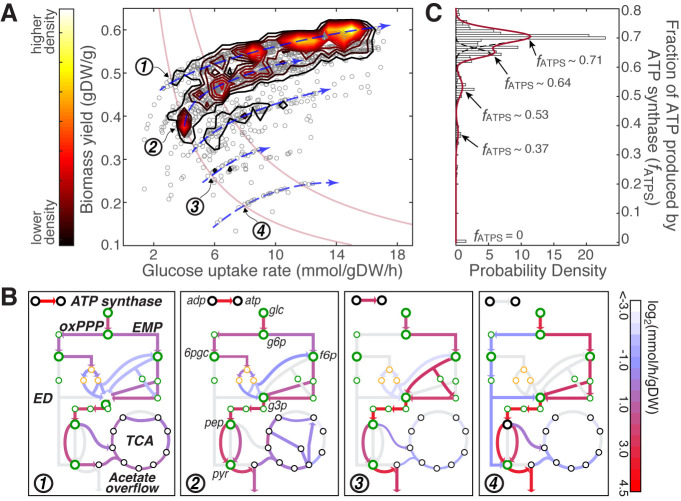
Fig 1. Multimodal distribution of fATPS determines the discrete metabolic state and the stratification of phenotypic landscape.
(A) Fitness effect calculated from 2,200 in silico E. coli strains shows a stratified phenotype distribution on the rate-yield plane. Blue arrows indicate the populated regions, within which metabolic flux distribution remains relatively constant. Two example μ-isoclines are highlighted by red solid lines. Numbers in the open circles indicate the locations of four in silico strains selected for metabolic flux analysis shown in panel B. (B) Four representative metabolic states are depicted by the flux distribution of major pathways in the central metabolism, including the glycolysis pathway (metabolites colored in green), oxidative pentose phosphate pathway (oxPPP, yellow), and the TCA cycle (black). Key metabolites indicated on the figure are, glc: glucose; g6p: D-glucose 6-phosphate; g3p: glyceraldehyde 3-phosphate; f6p: D-fructose 6-phosphate; pyr: pyruvate; 6pgc: 6-phospho-D-gluconate; pep: phosphoenolpyruvate. Calculated fluxes of each state are colored on a log scale. (C) Distribution of the computed fATPS fitted to a mixture of four Gaussian distributions. The result shows four peaks centered on 0.37, 0.53, 0.64, and 0.71. An additional peak is seen at fATPS = 0. Peaks in the multimodal distribution of fATPS are highly correlated with the populated regions on the rate-yield plane shown by the blue arrows in panel A.

