
Fig 3.
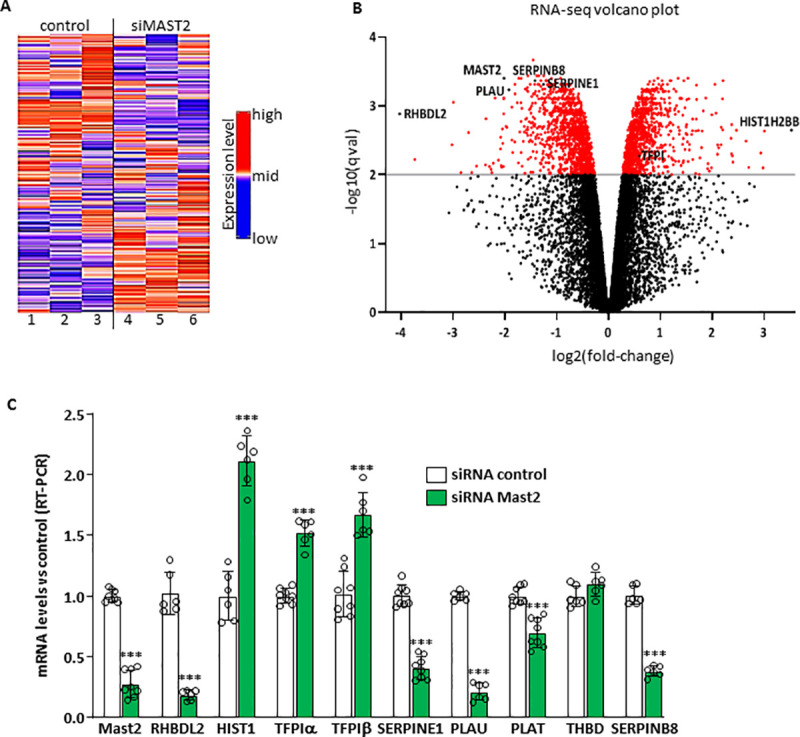
(A) Heatmap of the 5000 genes most differently expressed between cells treated with control siRNA (lanes 1–3) and with MAST2 specific siRNA (lanes 4–6). (B) volcano plot. (C) Validation of the RNA-seq. ECV304 cells were transfected with control siRNA or with two MAST2 specific siRNA. 48 hours post transfection, mRNA levels of MAST2, RHBDL2, HIST1H2BB (HIST1), TFPIα and β, SERPINE1, PLAU, PLAT, THBD and SERPINB8 were analyzed by RT-PCR. Data are means ± Standard Deviation. Statistical analyses were made using unpaired t-test. ***p<0.001: significant vs control.