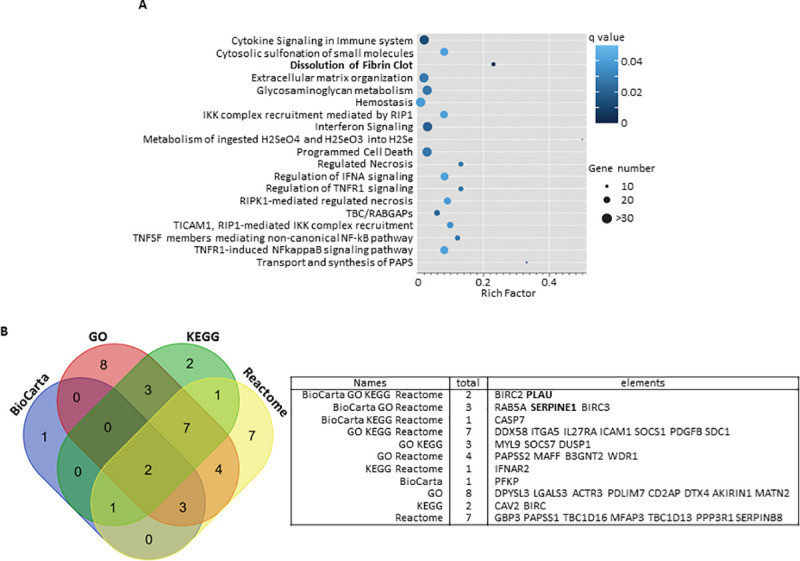
Fig 4.

(A) Scatter plot of Reactome pathways enrichment statistics. Rich factor is the ratio of the differentially expressed gene number to the total gene number in a certain pathway. q value is corrected p value. The color and size of the dots represent the range of the q value and the number of differently expressed genes mapped to the indicated pathways, respectively. (B) Venn diagram showing the overlap of genes of the enriched biological pathways identified using BioCarta, GO, KEGG and Reactome pathway databases (S4 Table).
