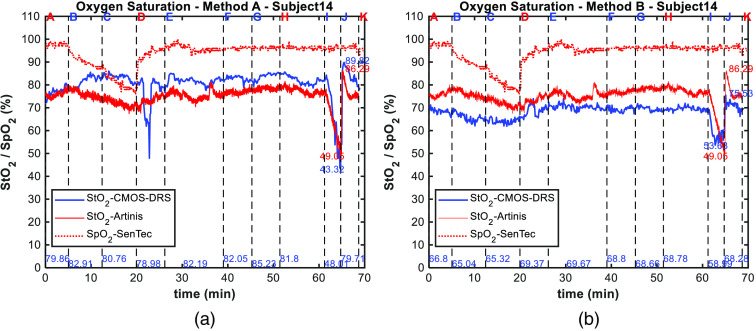
Fig. 7.
(a) Oxygen saturation readings for subject 14 using method A, (b) using method B. Measurements of the tissue oxygen saturation obtained using the CMOS-DRS (blue line) and Artinis (red line) systems are plotted along with the pulsed oxygen saturation measured by the SenTec sensor (red dotted line). At the bottom of figure are indicated in blue mean CMOS-DRS values for last 30 s of each protocol step, and near the curves min and max of value at ischemia for both sensors (in blue for CMOS-DRS and in red for Artinis). Vertical black dashed lines and letters on top correspond to protocol steps.

