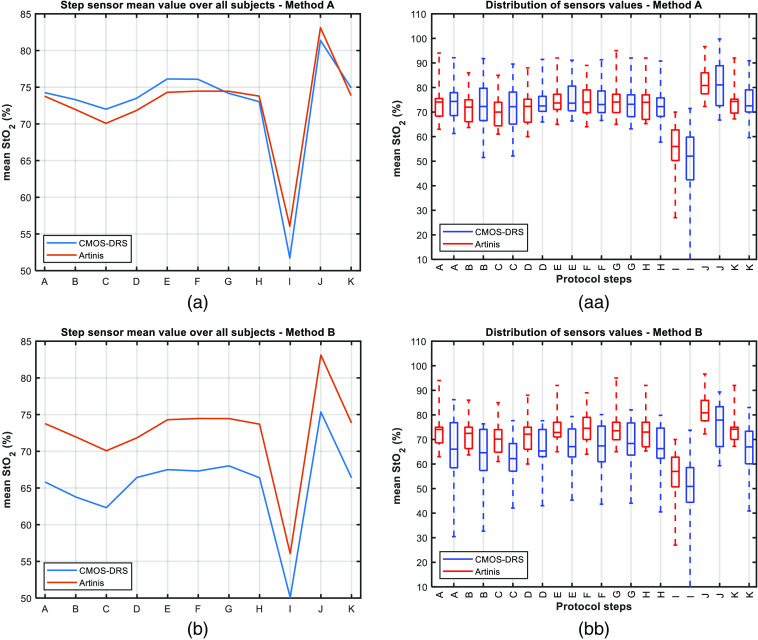
Fig. 8.
(a), (b) mean value for all subjects measured with the reference (red) and CMOS-DRS (blue) sensors. (aa), (bb) Value distribution for each step as measured with the reference (red) and CMOS-DRS sensor (blue). On each box, the median value is represented by the central mark. Bottom and top edges of the box indicate the 25th and 75th percentiles of the measurements, respectively. (a, aa) using method A. (b), (bb) using method B.

