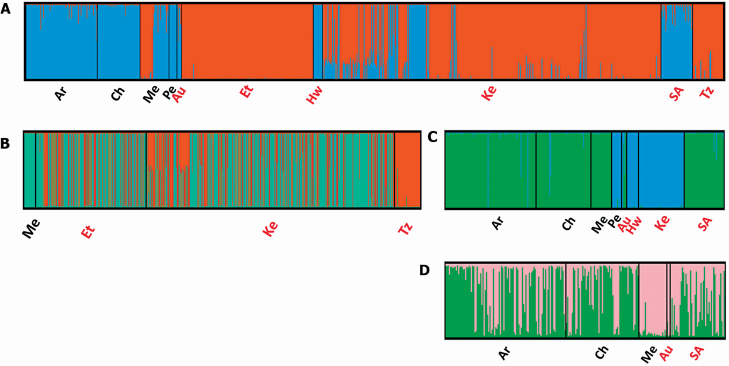
Figure 4.
Hierarchical Bayesian clustering analyses of individuals of native (black labels) and non-native (red labels) populations of various Prosopis species and putative hybrids: Argentina (Ar) = P. alba, P. chilensis, P. flexuosa, P. strombulifera, P. nigra, P. torcuata and P. vinalillo, putative hybrids and Prosopis spp. individuals; Chile (Ch) = P. alba, P. chilensis, and Prosopis spp. individuals; Mexico (Me) = P. juliflora and P. laevigata; Peru (Pe) = P. pallida; Australia (Au) = P. glandulosa, P. pallida, P. velutina and putative hybrids; Ethiopia (Et) = P. juliflora; Hawaii (Hw) = P. pallida; Kenya (Ke) = P. juliflora and P. pallida; South Africa (SA) = Prosopis spp. individuals; Tanzania (Tz) = P. juliflora. Individuals were genotyped using seven nuclear microsatellite loci and clustered at three levels. (A) Level 1: ‘P. juliflora’ cluster in orange and ‘other Prosopis species’ cluster in blue; (B) Level 2: only P. juliflora individuals and (C) Level 2: ‘P. pallida’ cluster in blue ‘other Prosopis species’ cluster in green; (D) Level 3: individuals of ‘other Prosopis species’ cluster from Argentina, Chile, Mexico, Australia and South Africa. Vertical axes represent the assignment (qik values) of individual genomes to the inferred number of genetic clusters, in all cases K = 2 [see Supporting Information—Fig. S1].

