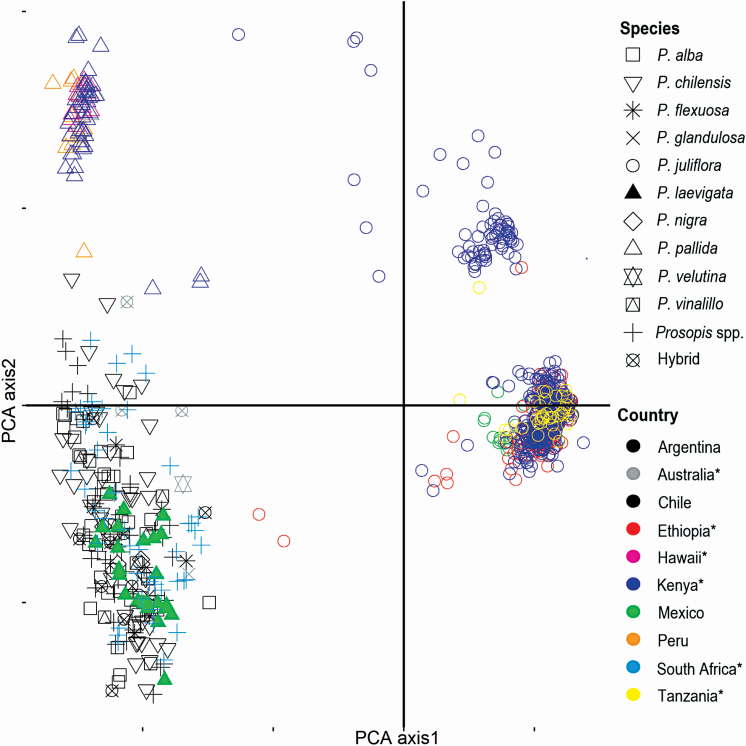
Figure 5.
Principal component analysis (PCA) showing genetic structure among native and non-native populations of different Prosopis taxa and their putative hybrids. Countries from which non-native populations originated are indicated by asterisks (*). PCA was performed using Bruvo distances calculated in PolySat (Bruvo et al. 2004). PCA 1 and PCA 2 captured 63.6 % and 11.0 % of the variation, respectively.

