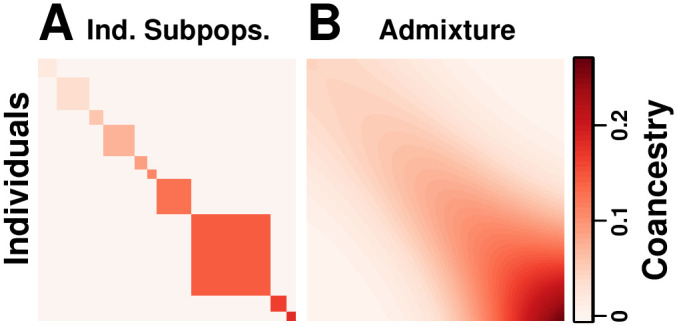
Fig 2. Coancestry matrices of simulations.

Both panels have n = 1000 individuals along both axes, K = 10 subpopulations (final or intermediate), and FST = 0.1. Color corresponds to between individuals j and k (equal to off-diagonal, along the diagonal). (A) The independent subpopulations model has between subpopulations, and varying per subpopulation, resulting in a block-diagonal coancestry matrix. (B) Our admixture scenario models a 1D geography with extensive admixture and intermediate subpopulation differentiation that increases with distance, resulting in a smooth coancestry matrix with no independent subpopulations (no between blocks). Individuals are ordered along each axis by geographical position.
