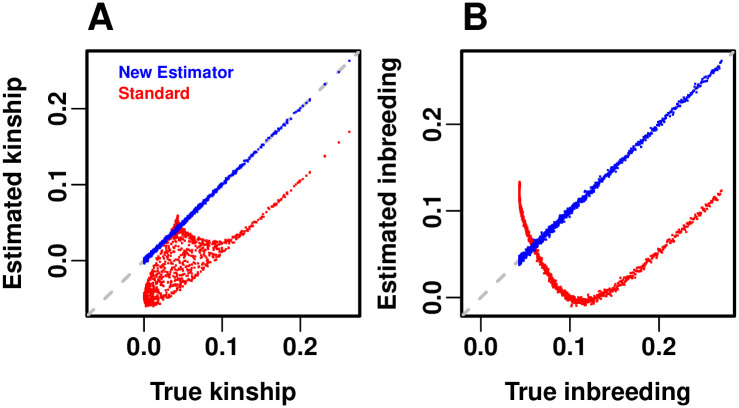
Fig 6. Accuracy of kinship estimators.
Here the estimated kinship values are directly compared to their true values, in the same admixture simulation data (n = 1000 individuals) shown in the previous figure. (A) Kinship between different individuals (excluding inbreeding). The new estimator has practically no bias in this evaluation (falls on the 1-1 dashed gray line). The standard estimator has a complex, non-linear bias that covers a large area of errors. (B) Inbreeding comparison, shows the bias of the standard estimate follows a different pattern for inbreeding compared to kinship between individuals. To better visualize and compare data across panels, a random subset of n points (out of the original n(n − 1)/2 unique individual pairs) were plotted in (A), matching the number of individuals (number of points in (B)).

