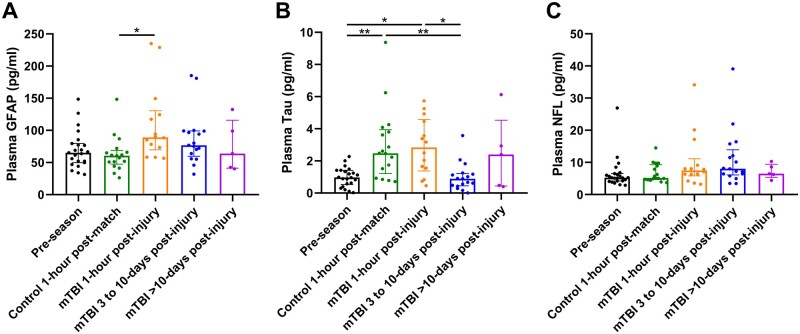
Figure 1.
Plasma concentration of biomarkers among different groups. (A) GFAP, (B) tau and (C) NFL. Scattered dots represent the concentration for each individual. Box and bars represent the median and the interquartile range of each group. Kruskal–Wallis test with post hoc Dunn’s test *P < 0.05, **P < 0.01.

