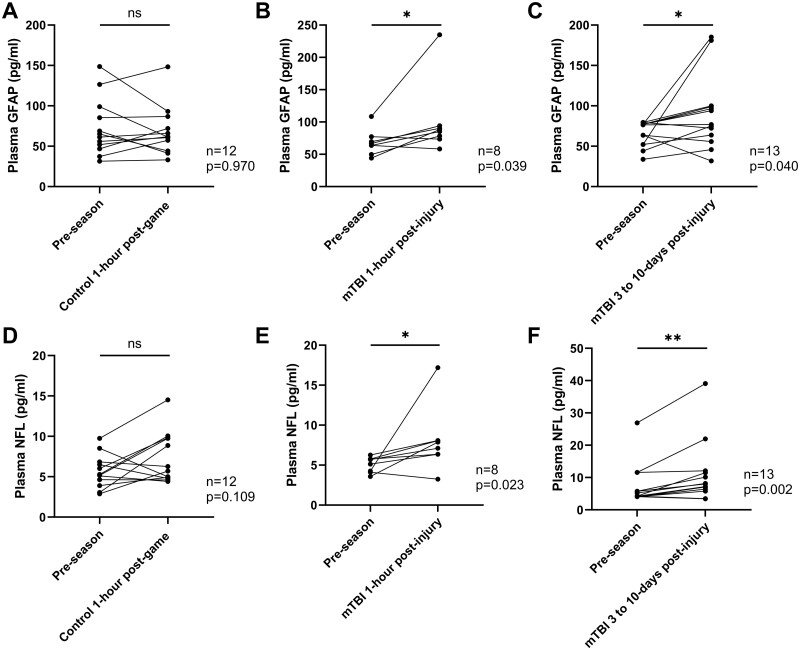
Figure 2.
Changes in the plasma concentration of biomarkers. (A–C) GFAP and (D–F) NFL in the same player. The pre-season level of GFAP and NFL are compared to the level of the Control 1-h post-match group (A and D, n = 12), the level of mTBI 1-h post-injury group (B and E, n = 8) and to the level of the mTBI 3- to 10-day post-injury group (C and F, n = 13). Scattered dots represent the biomarker concentration for each individual; Wilcoxon matched-pairs signed rank test, *P < 0.05, **P < 0.01, ns, not statistically significant.

