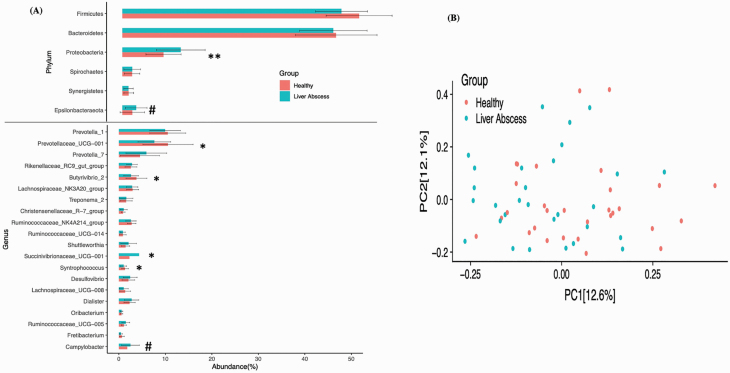
Figure 2.
Phylum and genus differences in the rumen papillae of cattle with and without liver abscesses. (A) The bar plot with error bars is showing the phylum and genus level difference in relative abundance between healthy and liver-abscessed animals. The phyla and genera with at least 1% abundances are shown on y-axis and their abundances on x-axis. The difference in relative abundance of different phyla and genera between healthy and liver-abscessed animals was tested with Wilcox text (#P < 0.1; *P < 0.05; **P < 0.01). (B) The Bray–Curtis distance matrix was used to run PCoA and PERMANOVA analysis. The first two components (PC1 and PC2) of PCoA were plotted to see the bacterial community differences between healthy and liver-abscessed animals.

