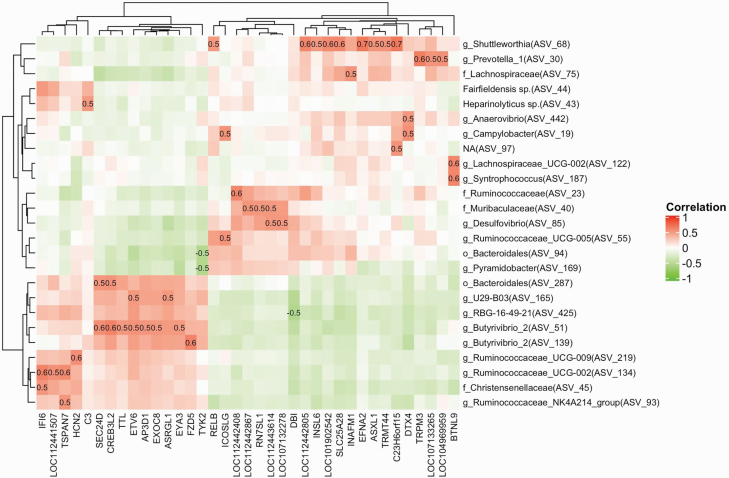
Figure 3.
Heatmap of the highest correlated (−0.5 > R > 0.5) ASVs and DEG genes present in cattle rumen papillae. The prevalent ASVs (n = 194; present in at least 50% of the rumen papillae samples) were used to run a Pearson correlation with DEG genes (n = 221). The log10-transformed relative abundances of prevalent ASVs and DEG genes were used to generate correlation matrix. The x-axis is representing the ASVs whereas the DEG genes are on y-axis.

