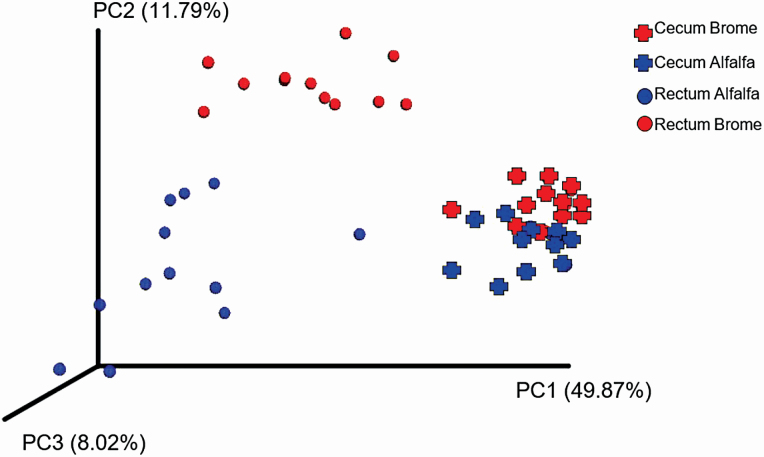
Figure 6.
Effect of hay type and sampling location on beta diversity. Beta diversity was analyzed using the weighted Unifrac distance matrix, visualized on a PCoA plot, and comparisons were made using permutational multivariate analysis of variance. Hay type (brome or alfalfa) was fed ad libitum to horses; sampling locations included the cecum and rectum; An interaction effect of hay type by location (P < 0.05) was found.

