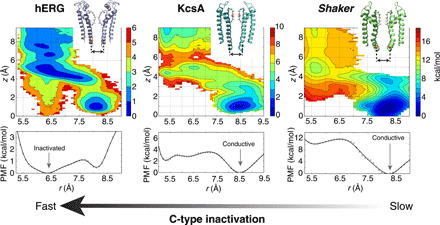
Fig. 3. Comparison of the free energy landscape for the hERG, KcsA, and Shaker channels.

The opening of the intracellular gate was selected to be almost the same for all these channels (16 to 18 Å). In the 2D-PMFs, the horizontal reaction coordinate r describes the constriction of the selectivity filter (defined as the average cross-diagonal distance between the Cα atoms of the central glycine equivalent to G77 in KcsA). The vertical reaction coordinate z indicates the position of the external K+ ion along the pore relative to its center of the selectivity filter. The bottom panel shows the integrated 1D-PMFs along r. The PMF for WT KcsA from a similar calculation was reported previously (18). The PMF for Shaker was calculated using a model based on the x-ray structure (PDB ID: 2R9R) of the Kv1.2/Kv2.1 chimera channel (57).
