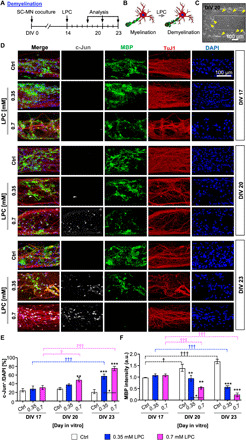
Fig. 2. Reconstruction of 3D demyelination in SC-MN coculture by LPC treatment.

(A) Schematic diagram displaying the time course of LPC introduction and demyelination analysis in the SC-MN myelination model. To induce demyelination, cocultures were treated with 0.35 or 0.7 mM LPC, and the demyelination of SC-MN cocultures was measured by immunocytochemistry at DIV 17, 20, and 23. Fixed samples were immunostained with antibodies against c-Jun (gray), myelin basic protein (MBP; green), tubulin beta III (TuJ1; red), and 4′,6-diamidino-2-phenylindole (DAPI) (blue). (B) Schematic illustrations displaying the SC-MN coculture from myelination to demyelination. (C) Representative bright-field image for establishment of a demyelinating coculture system. Demyelination was rapidly induced by LPC treatment, and uneven nerve fiber (yellow arrowheads) was observed in the gel channel at DIV 20. (D) Representative confocal images of cocultures and quantification of c-Jun+ cells (E) and MBP intensity (F) with or without 0.35 or 0.7 mM LPC treatment, respectively. The graph shows mean ± SEM values from at least three independent experiments using different mice. *P < 0.05, **P < 0.01, and ***P < 0.001 compared with the control. †P < 0.05 and †††P < 0.001 compared with each value at DIV 17 [one-way analysis of variance (ANOVA), Tukey’s multiple comparison tests]. a.u., arbitrary units.
