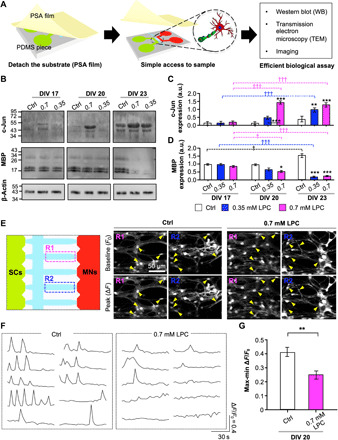
Fig. 3. Confirmation of 3D demyelination with effective biochemical analysis on a 3D PNS disease platform.

(A) Schematic descriptions of our easy-to-use platform with the PSA-coated PC film for efficient biological analysis [Western blot (WB), TEM, and imaging]. (B) Representative immunoblots and quantification of c-Jun (C) and MBP (D). *P < 0.05, **P < 0.01, and ***P < 0.001 compared with the control. †P < 0.05 and †††P < 0.001 are compared with each value at DIV 17 (one-way ANOVA, Tukey’s multiple comparison tests). Intracellular Ca2+ levels of coculture with or without LPC were analyzed at DIV 20 using the Oregon Green 488 BAPTA-1 AM staining kit. (E) Representative inverted confocal images of BAPTA-1 AM signals in two random gel channel regions—R1 and R2 (left)—showing the time points of the baseline (F0) and peak (∆F) levels (middle and right), (F) cell recording, and (G) quantification of the relative change of intracellular Ca2+ on coculture with or without LPC. Arrowheads indicate cocultured cells at the F0 and ∆F levels. The graph shows mean ± SEM values from three [in (B)] and at least seven independent experiments [in (G)] using different mice. In (G), an average of 14 cells per independent experiment was calculated. **P < 0.01 compared with control (unpaired, two-tailed t test with Welch’s correction).
