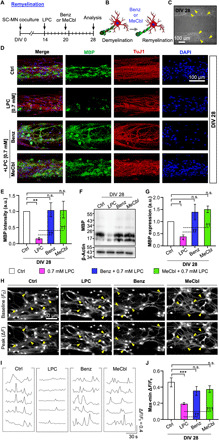
Fig. 4. Reconstruction of 3D remyelination by either Benz or MeCbl treatment on demyelinated SC-MN coculture.

(A) To verify remyelination, cocultures were cotreated with Benz (1.5 μM) or MeCbl (10 μM) in the presence of LPC at DIV 20 and analyzed at DIV 28. (B) Schematic illustrations displaying the coculture from demyelination to remyelination. (C) Representative bright-field image for establishment of a remyelinating coculture system. (D) Representative confocal images of cocultures with MBP (green), TuJ1 (red), and DAPI (blue); (E) quantification of MBP intensity and (F) immunoblots; and (G) quantification of MBP on cocultures with Benz or MeCbl in the presence and absence of LPC are shown. (H) Representative inverted confocal images of BAPTA-1 AM signals showing the time points of the baseline (F0) and peak (∆F) levels, (I) cell recording, and (J) quantification of the relative changes in intracellular Ca2+ in cocultures with LPC only and with LPC plus Benz or MeCbl treatment. In (F) and (J), the graph shows mean ± SEM values from three independent experiments using different mice. In (J), an average of 13 cells per independent experiment was calculated. *P < 0.05, **P < 0.01, and ***P < 0.001 compared with the control; ††P < 0.01 and †††P < 0.001 compared with the LPC treatment (one-way ANOVA, Tukey’s multiple comparison tests). n.s., no statistically significant difference.
