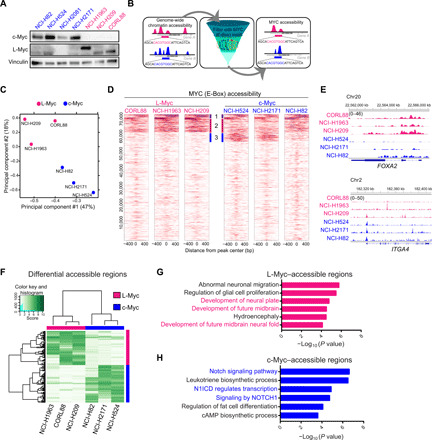
Fig. 2. c-Myc– and L-Myc–driven SCLCs exhibit distinct chromatin states to regulate distinct transcriptional programs.

(A) Protein expression of c-Myc and L-Myc as well as vinculin as a loading control in a panel of representative SCLC cell lines (blue, c-MYC–classified lines; pink, L-MYC–classified lines). (B) Schematic showing the analytic approach to defining MYC-accessible regions. (C) PCA of open chromatin regions with E-box motif in six SCLC cell lines. Each dot represents a SCLC cell line that is colored on the basis of Myc status (blue, c-Myc–classified cell lines; pink, L-Myc–classified cell lines). (D) Each heatmap depicting global MYC (E-box) accessibility in individual SCLC cell lines at 72,833 combined peaks. ATAC-seq signal intensity is shown by color shading. bp, base pair. (E) Genome browser view tracks of ATAC-seq signals at the FOXA2 and ITGA4 loci (pink, L-Myc–classified cell lines; blue, c-Myc–classified cell lines). (F) Heatmap showing 2808 differentially accessible regions [fold change, ≥5; false discovery rate (FDR), ≤0.05] between three L-Myc cell lines shown in pink and three c-Myc cell lines shown in blue. (G) Enriched ontology by GREAT (Genomic Regions Enrichment of Annotations Tool) analyses for regions differentially accessible in L-Myc–classified cells. (H) Enriched ontology by GREAT analyses for regions differentially accessible in c-Myc–classified cells. cAMP, cyclic adenosine 3′,5′-monophosphate.
