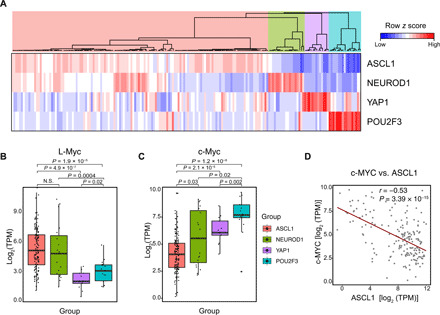
Fig. 3. c-Myc and L-Myc expression is associated with distinct molecular subtype markers.

(A) Unsupervised clustering of 137 primary tumors and 51 CCLE cell lines using the expression of ASCL1, NeuroD1, POU2F3, and YAP1 distinguishing four molecular subtypes (table S4). (B) Box plot showing mRNA expression of L-Myc across four molecular subtypes for combined primary tumor and cell line classification described in (A). (C) Box plot showing mRNA expression of c-Myc across four molecular subtypes for combined primary tumor and cell line classification described in (A). (D) Scatterplot with best-fit line showing negative correlation between c-Myc and ASCL1 expression for combined primary tumor and cell lines. Pearson’s correlation coefficient (r) = −0.53, P < 0.01, t test. N.S., not significant; TPM, transcripts per million.
