
Fig. 4. L-Myc induces neuronal state not defined by ASCL1 expression.
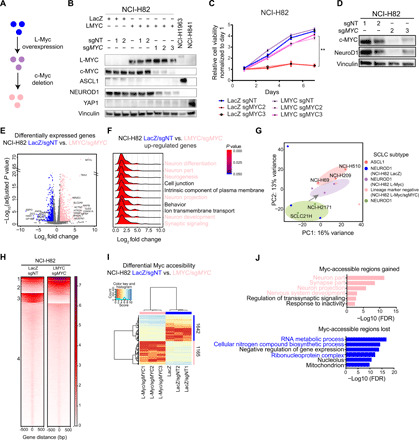
(A) Workflow schematic to genetically engineer replacement of c-Myc with L-Myc. (B) Protein expression of L-Myc, c-Myc, ASCL1, NeuroD1, and YAP1, with vinculin as a loading control in replaced NCI-H82 cells. Quantified in fig. S5A. (C) Cell growth curve for genetically engineered NCI-H82 cells. **P < 0.01 versus Lac-Z/sgNT NCI-H82 cells, t test. (D) Protein expression of c-Myc and NeuroD1 with vinculin as a loading control in NCI-H82 cells with c-Myc ablation. Quantified in fig. S5F. (E) Volcano plot showing 1213 differentially expressed genes (713 up-regulated in pink and 500 down-regulated in blue). NCI-H82 (LacZ and LacZ/sgNT) versus NCI-H82 (LMYC/sgMYC). (F) Ridge plot showing distribution of fold change for genes in each enriched GO term for up-regulated genes (E). (G) PCA of 14 SCLC cell lines; including 3 ASCL1, 2 NEUROD1, and 9 genetically engineered NCI-H82 cells; 3 control (LacZ, LacZ/sgNT1, or LacZ/sgNT2); 3 L-Myc overexpressed (L-Myc, L-Myc/sgNT1, and L-Myc/sgNT2); and 3 c-Myc replaced with L-Myc (L-Myc/sgMYC1, L-Myc/sgMYC2, and L-Myc/sgMYC3). PC, principal component. (H) Each heatmap depicting k-means (k = 4) clustering of global Myc accessibility in NCI-H82 LacZ/sgNT (left) and NCI-H82 L-MYC/sgMYC (right) at 170,711 combined peaks. ATAC-seq signal intensity is shown by color shading. (I) Heatmap showing 2807 differentially accessible regions (fold change, >16; FDR, <0.01) between three NCI-H82 control cells (LacZ, LacZ/sgNT1, and LacZ/sgNT2) and three c-Myc replaced by L-Myc (L-Myc/sgMYC1, L-Myc/sgMYC2, and L-Myc/sgMYC3). (J) Enriched ontology by Cistrome-GO analyses for Myc-accessible regions gained (top) and lost (bottom) after replacement.