
Fig. 6. c-Myc rewires Myc-accessible chromatin regulatory elements to regulate distinct lineage-associated pathways.
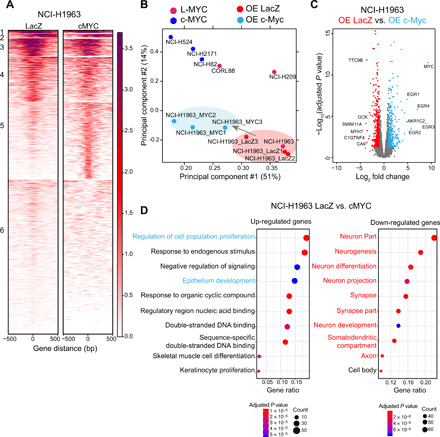
(A) Each heatmap depicting k-means (k = 6) clustering of global Myc (E-box) accessibility in NCI-H1963 overexpressing (OE) LacZ (left) and NCI-H1963 overexpressing cMYC (right) at 44,722 combined peaks. ATAC-seq signal intensity is shown by color shading. (B) PCA of open chromatin regions with E-box motif in six SCLC cell lines in addition to NCI-H1963–LacZ (control) and NCI-H1963–c-Myc in triplicate. Each dot represents a SCLC cell line that is colored on the basis of Myc status (pink, L-MYC; blue, c-MYC; red, NCI-H1963 LacZ; light blue, NCI-H1963 cMYC). (C) Volcano plot showing 775 differentially expressed genes (375 up-regulated in light blue and 400 down-regulated in red) between control NCI-H1963 cells with LacZ overexpression cells and NCI-H1963 cells with c-Myc overexpression. (D) Dot plot showing GO analysis for differentially up-regulated (right) and down-regulated (left) genes.