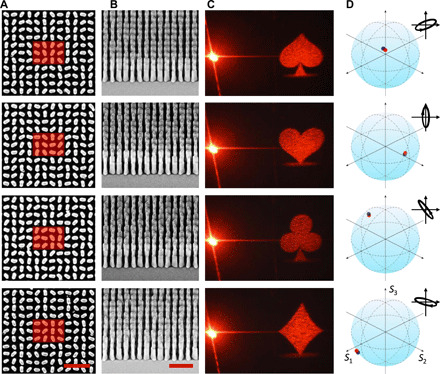
Fig. 4. Full polarized meta-hologram.

(A) Top view and (B) tilt view of the SEM images of the metasurfaces. The red rectangular highlight area in (A) shows one pixel of the meta-holograms. (C) Measured holographic images (illumination at λ = 600 nm) of the meta-holograms. (D) Measured SoP on Poincaré sphere. Red dots, designed value; blue dots, measured value. Scale bars, 1 μm (A and B).
