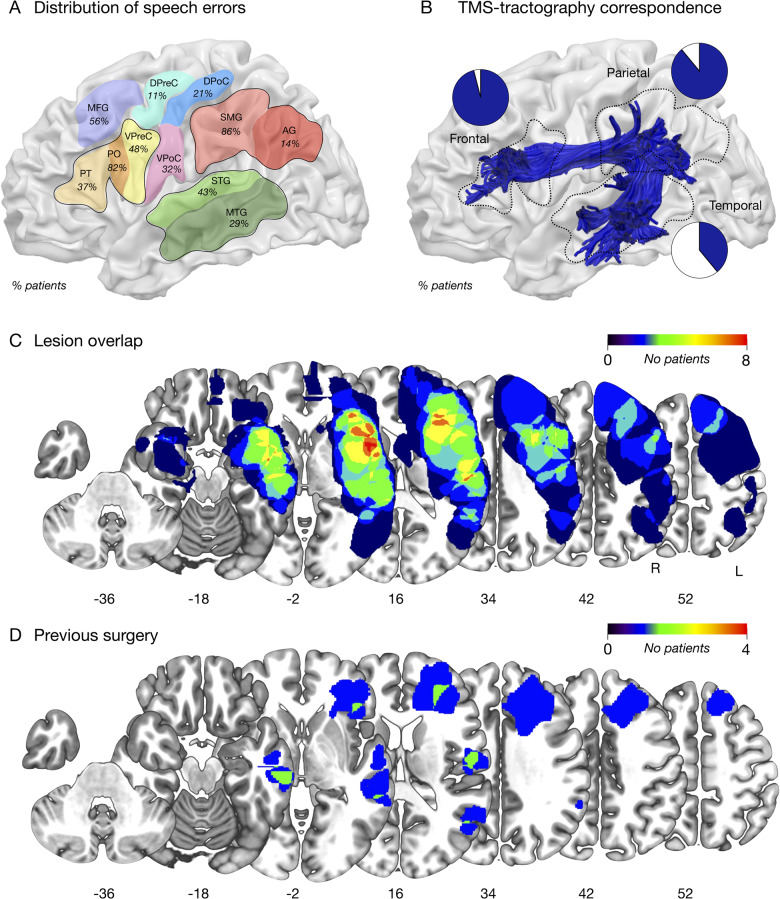
Figure 2.
Correspondence between TMS and tractography. (A) The proportion of patients in which speech errors were induced by TMS in different cortical perisylvian sectors. (B) The proportion of patients with an error site that corresponded to a cortical termination of the entire arcuate fasciculus (shown on a 3D standard space template in blue), within each lobe. (C) Percentage overlay map of the tumour locations in left hemisphere perisylvian regions. (D) Percentage overlay map of the previous resections in left hemisphere perisylvian regions.

