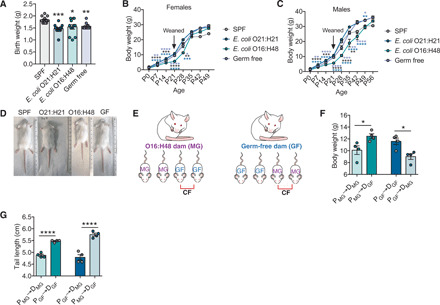
Fig. 2. Cross-fostering rescues stunted growth exhibited by E. coli O16:H48 pups.

(A) Birth weights of pups (n = 10 to 12 per condition). (B and C) Body weights at birth (P0) to adulthood (P49 to P56) for (B) females (P0, n = 10 to 12; P7, n = 9 to 11; P14, n = 10 to 11; P21, n = 7 to 11; P28, n = 4 to 10; P35, n = 7 to 10; P42, n = 7 to 10; P49, n = 6 to 11) and (C) males (P0, n = 10 to 12; P7, n = 9 to 11; P14, n = 10 to 11; P21, n = 7 to 11; P28, n = 10 to 13; P35, n = 9 to 11; P42, n = 9 to 13; P49, n = 9 to 12; P56, n = 5 to 9). From P0 to P21, the data represent the weights of both male and female littermates and therefore show the same data in (B) and (C) for those time points. Males and females were separated at the time of weaning, and data points beginning at P28 represent the weights of the sex indicated. (D) Representative images of pups at P21 to P24. (E) Experimental scheme of maternal cross-fostering. Immediately after birth, half of the litter is fostered by a different dam, and half of the litter remains with their biological dam. MG (for MG1655) indicates E. coli O16:H48 pups and dams; GF indicates GF pups and dams. (F) Body weight of pups at P21 after cross-fostering (P, pup; D, dam; MG, E. coli O16:H48; n = 4 per condition). (G) Tail length of cross-fostered pups at P21 (P, pup; D, dam; MG, E. coli O16:H48; n = 4 per condition). Statistical significance was determined using one-way ANOVA with post Tukey test or Kruskal-Wallis test with Dunn’s multiple comparison for pairwise analyses. Significance stars are colored to indicate which condition significance is referring to. *P < 0.05 [P = 0.05 for (A)], **P < 0.01, ***P < 0.001, and ****P < 0.0001. Error bars represent means ± SEM. Scatter plot data for each time point for (B) and (C) are shown in fig. S1. Photo credit: Yujung Michelle Lee, Salk Institute.
