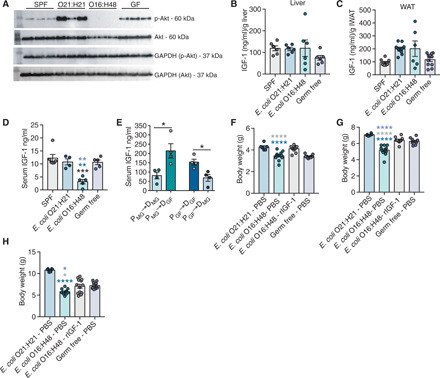
Fig. 6. Impaired IGF-1 signaling in E. coli O16:H48 neonates.

(A) IGF-1 signaling levels in liver at P3 determined by measuring phosphorylated Akt and Akt levels. GAPDH for loading control (n = 3 per condition). Uncropped blots are in fig. S9. (B) IGF-1 protein levels in liver at P3 (n = 6 per condition). (C) Adipose tissue IGF-1 protein levels at P3, n = 6 to 11 per condition. (D) Serum IGF-1 levels at P3 (n = 4 to 6 pups per condition). (E) Serum IGF-1 levels at P21 from cross-fostering experiments (n = 4 per condition). (F to H) Body weight measurements of animals treated with daily intraperitoneal injection of mouse rIGF-1 or PBS vehicle control at (F) P7, (G) P14, and (H) P21; n = 6 to 13 per condition. Statistical significance was determined using one-way ANOVA with post Tukey test or unpaired t test. Significance stars are colored to indicate which condition significance is referring to. *P < 0.05, **P < 0.01, ***P < 0.0005, and ****P < 0.0001. Error bars represent means ± SEM.
