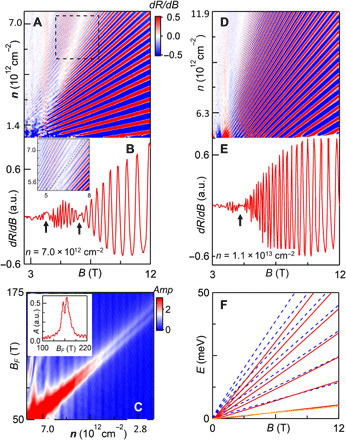
Fig. 2. Beating patterns in SdH oscillations from device D2 at T = 0.3 K.

(A) dRxx/dB(n, B) at E⊥ = 0.33 V/nm. (B) Line trace of (A) at n = 7.0 × 1012 cm−2. Arrows indicate nodes of oscillations. Inset: Zoom-in plot of the dashed square in (A). Dashed line indicates the transition from minima to maxima. a.u., arbitrary units. (C) Fast Fourier transform of the data in (A), display two distinct frequencies. Inset: line trace of fast Fourier transform amplitude versus BF at n = 2.8 × 1012 cm−2. (D) dRxx/dB(n, B) at E⊥ = 0. (E) Line trace of (D) at n = 1.1 × 1013 cm−2. (F) LL energies calculated using Eq. 1 and α = 1.0 × 10⁻¹¹ eVm. The orange line denotes the zeroth LL, whereas the red solid and blue dashed lines represent spin-up and spin-down levels for N > 0.
