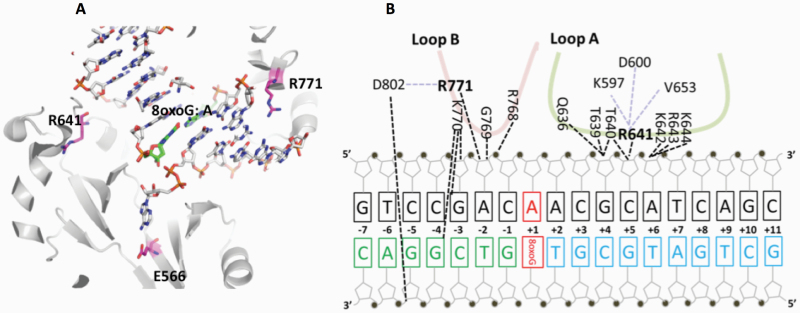
Figure 6.
Architecture of LIG1 showing the positions of the disease-associated residues in complex with the nicked DNA containing 8-oxoG:A. (A) Ribbon diagram shows LIG1 (grey) encircling the nicked DNA (sticks) with 8-oxoG opposite template A (green). E566, R641 and R771 (magenta) are represented by sticks. (B) Nucleotide-residue contact map showing individual LIG1 residues interactions that are close proximity to R641 (loop A, green) and R771 (loop B, red) with the nicked DNA containing 8-oxoG:A.

