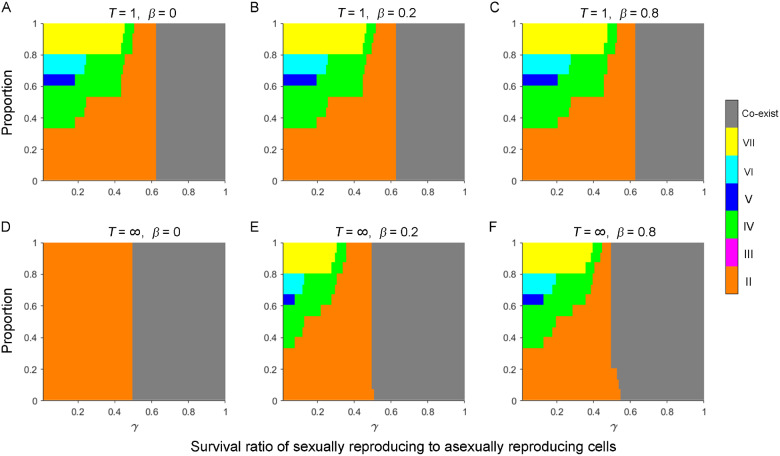
Fig. 3.
Patterns of mating type composition at equilibrium under different combinations of parameters. Populations initially contained equal proportions of any two mating types. The stacked bar charts depict differences in the proportion of parameter space for fixation of a specific mating type or for the coexistence of all six mating types in populations with different parameter values. (A–F) We varied the number of cell pairing rounds, T = 1 (A–C) and T=∞ (D–F); and the probability of paired cells separating, β = 0 (A and D), β = 0.2 (B and E), and β = 0.8 (C and F). Other parameters were population size, N = 106; number of asexual growth rounds, n = 100; and SD pattern, =0.302 (II), 0.010 (III), 0.271 (IV), 0.047 (V), 0.118 (VI), and 0.252 (VII). We assumed no fitness differences between cells of different mating types during asexual growth. Results show the average of 15 random combinations of two initial mating types.

