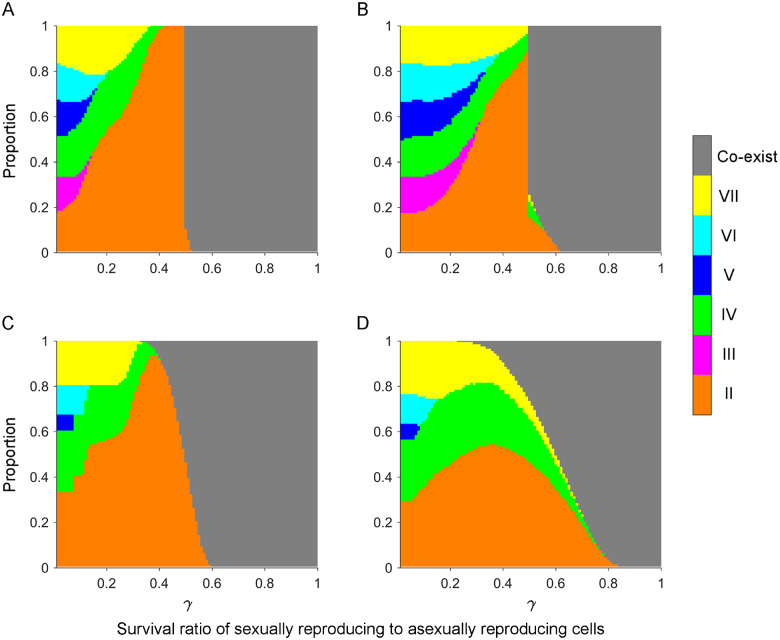
Fig. 5.
Fluctuations in initial mating type frequency and SD pattern affect mating type composition. Populations initially contained equal proportions of any two mating. (A–D) Frequencies of the initial two mating types (A and B) or SD pattern (C and D) varied by 5% and 30%, respectively. Parameters were population size, N = 106; number of asexual growth rounds, n = 100; number of cell pairing rounds, T=∞; probability of paired cells separating, ; selection coefficient, ; and SD pattern, =0.302 (II), 0.010 (III), 0.271 (IV), 0.047 (V), 0.118 (VI), and 0.252 (VII). A total of 10,000 replicates were run for each random combination of two initial mating types.

