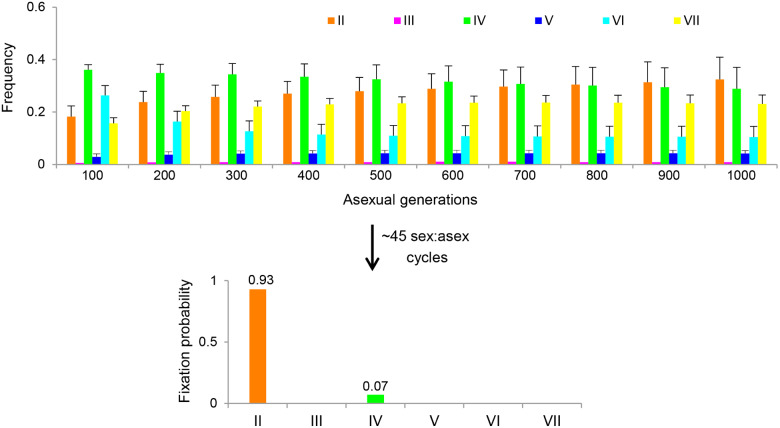
Fig. 6.
Predicted dynamics of mating type composition in experimental populations. Bar chart depicting the changes in mating type frequencies during the first ten sex:asex cycles. Error bars represent standard deviation. After about 45 cycles, mating type II and IV are predicted to be fixed with probabilities of 93% and 7%, respectively. To simulate fluctuations in parameter , we generated each value drawn from a normal distribution with mean and standard deviation that were estimated from the experimental populations and normalized it by the sum of all values in . A total of 10,000 replicates were run.

