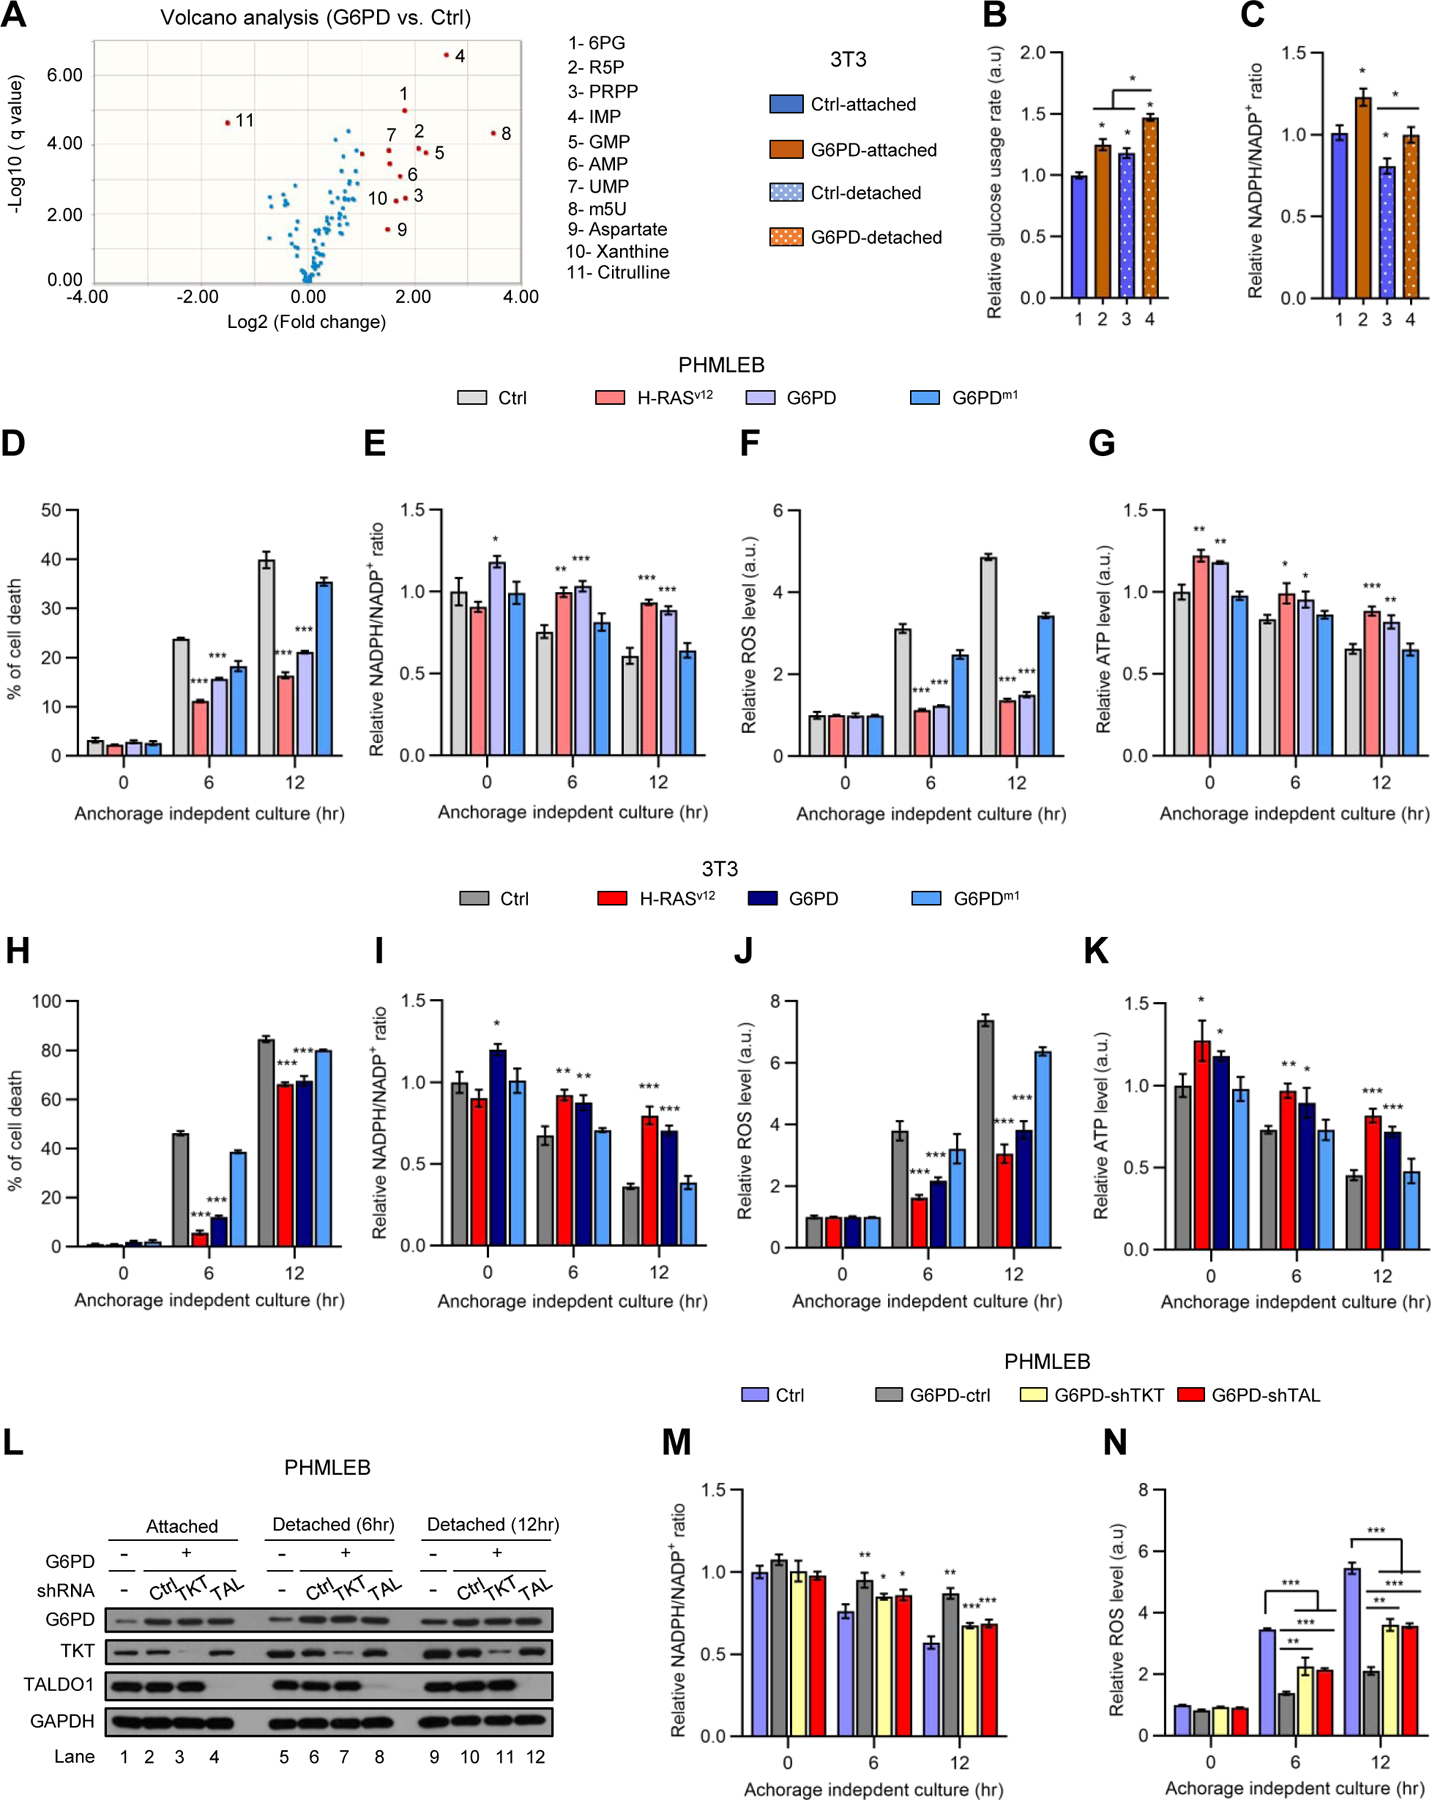
Figure 3. G6PD-induced anchorage-independent growth is associated with enhanced antioxidant capacity and nucleotide precursor availability.

(A) Volcano plot of metabolites detected by metabolomics analysis of 3T3/G6PD cells versus control NIH3T3 cells (see also Figure S3A), with red dots representing metabolites with change ≥ 2 fold and q-value < 0.05 and blue dots representing metabolites with change < 2-fold. m5U, ribothymidine.
(B and C) NIH3T3 and 3T3/G6PD cells grown under matrix-attached or -detached conditions for 4 hr were analyzed for glucose consumption (B, normalized by the number of viable cells) and the NADPH/NADP+ ratio (C).
(D–K) PHMLEB (D–G) and NIH3T3 (H–K) cells harboring H-RasV12, G6PD, G6PDm1, or control vector were cultured under matrix-attached condition (0 hr) or matrix-detached conditions for 6 or 12 hr. Cells were assayed for cell death (D and H), the NADPH/NADP+ ratio (E and I), ROS content (F and J), and ATP levels (G and K, normalized by protein concentration).
(L–N) PHMLEB and PHMLEB/G6PD cells expressing control (Ctrl), TKT, or TALDO1 (TAL) shRNA were cultured under matrix-attached condition (0 hr) or matrix-detached condition for 6 or 12 hr. Cells were assayed for protein expression (L), the NADPH/NADP+ ratio (M), and ROS content (N).
Data are means ± SD of representative result (n = 3). *P < 0.05, **P < 0.01, ***P < 0.001.
