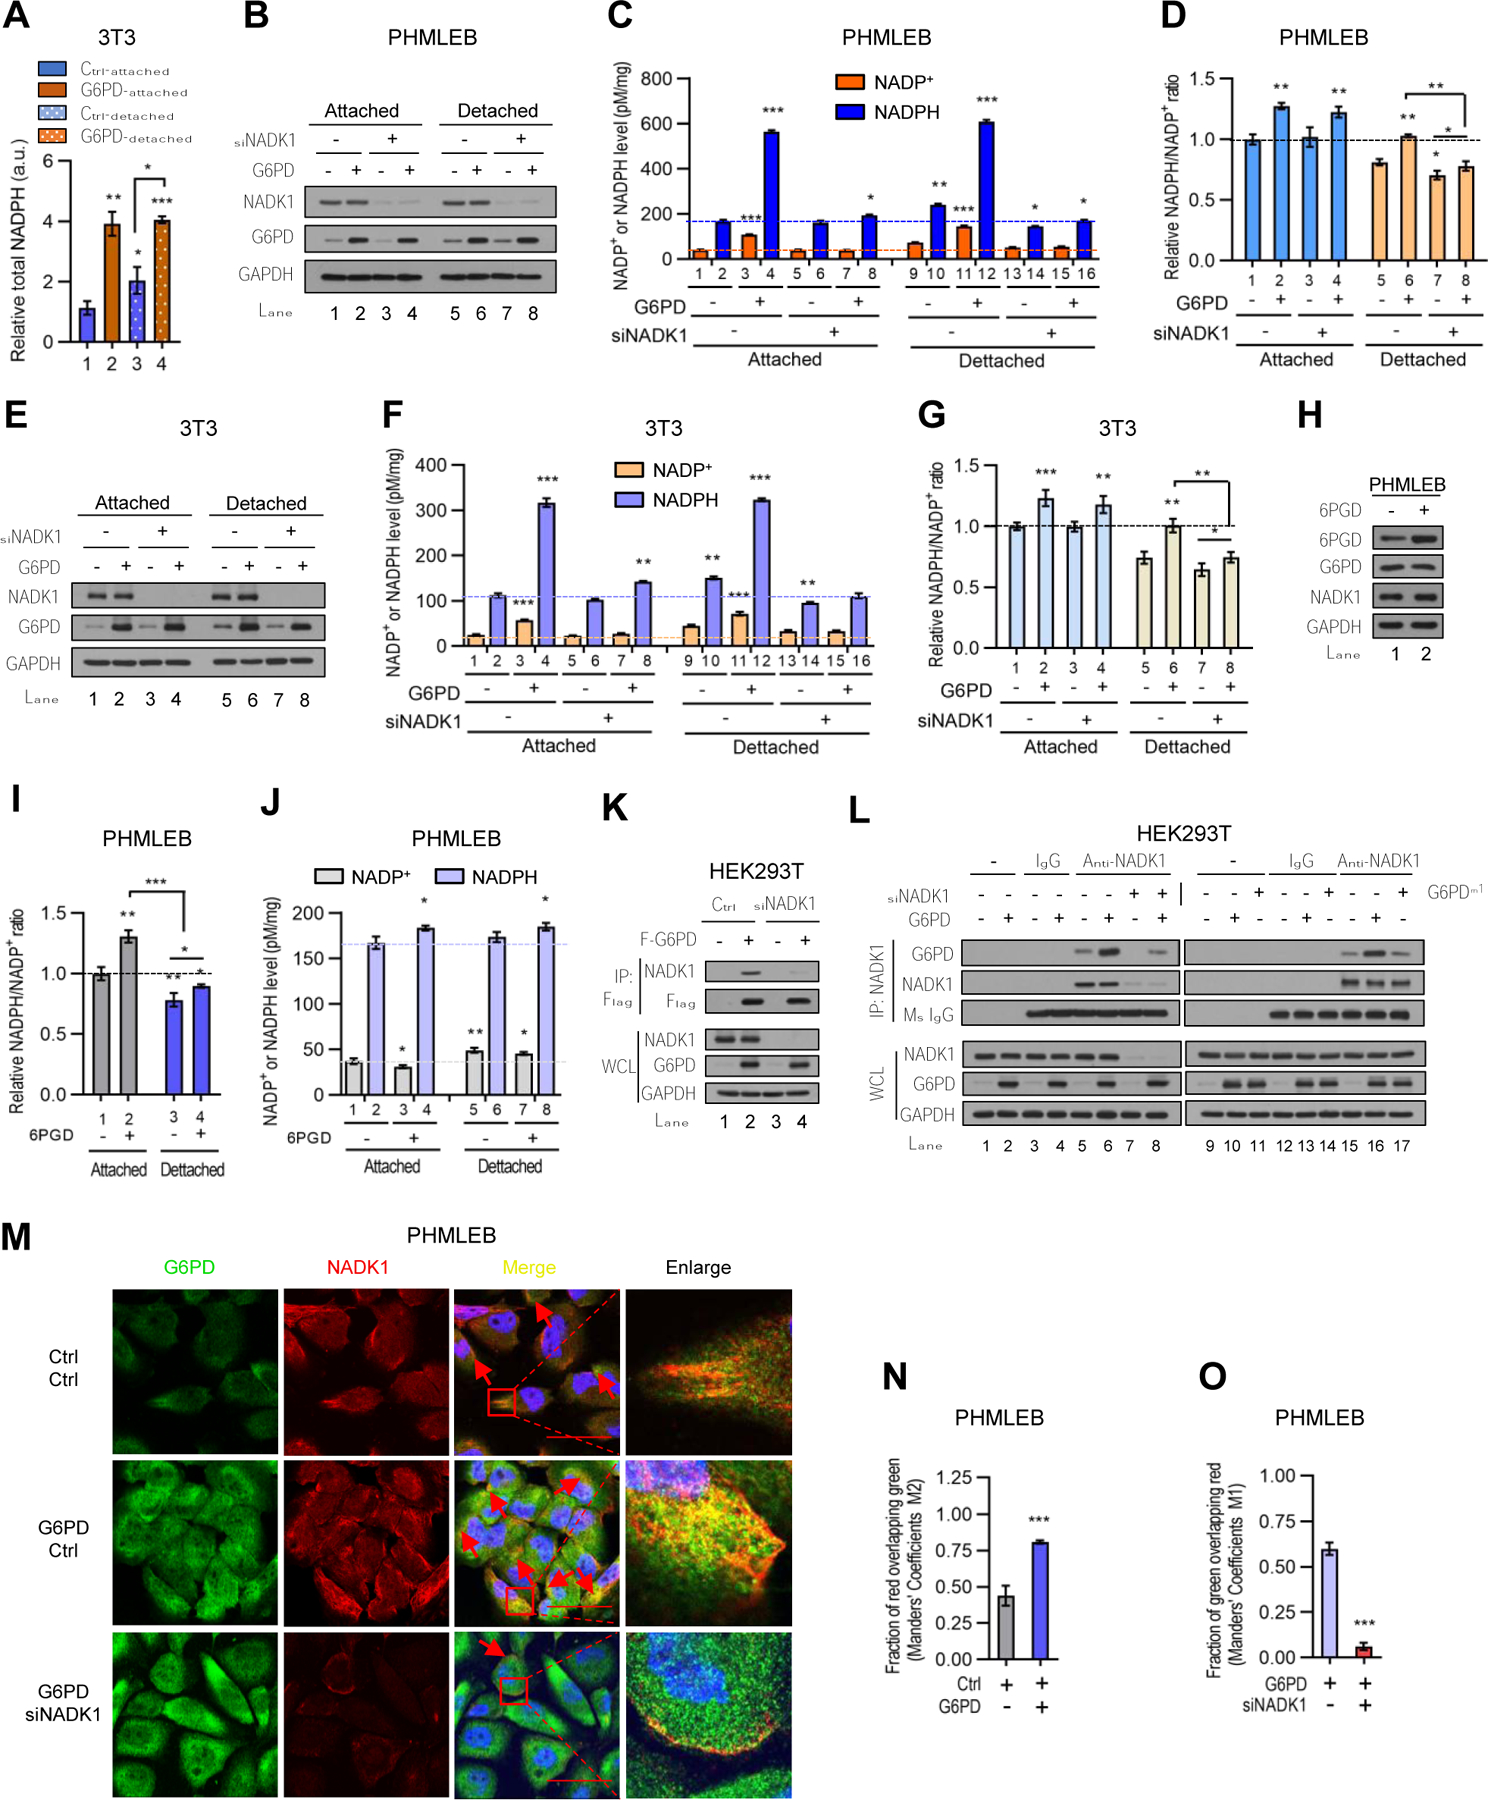
Figure 4. G6PD associates with and stimulates the activity of NADK1 increasing total NADP+ and NADPH pools.

(A) Control and G6PD-overexpressing NIH3T3 cells grown under matrix-attached or -detached conditions for 4 hr were analyzed for total NADPH pool size measured by LC-MS. The data were normalized by protein concentration.
(B–G) Control (−) or G6PD-overexpressing PHMLEB (B–D) and NIH3T3 (E–G) cells were transfected with control (−) or NADK1 siRNA and cultured under matrix-attached or -detached conditions for 6 hr. Cells were assayed for protein expression (B and E), cellular NADPH and NADP+ levels (C and F, normalized by protein concentration), and the NADP+/NADPH ratio (D and G).
(H–J) PHMLEB cells stably transduced with control (−) or 6PGD lentiviral vector were grown under matrix-attached or -detached condition for 6 hr and assayed for protein expression (H), the NADPH/NADP+ ratio (I), and total NADPH and NADP+ levels (J, normalized by protein concentration).
(K and L) Control (−) and NADK1-knockdown HEK293T cells were transfected with control, Flag-G6PD, or Flag-G6PDm1 plasmid as indicated. Cell lysates were incubated without antibody (−), or with control mouse IgG or an anti-Flag (K) or anti-NADK1 (L) antibody.
Immunoprecipitates and whole cell lysates (WCL) were analyzed by Western blot. (M–O) Immunofluorescence analysis of G6PD and NADK1 in PHMLEB cells transfected with control or G6PD plasmid (M and N), or with G6PD plasmid plus control or NADK1 siRNA (M and O), for the localization of G6PD (green) and NADK1 (red). Scale bar, 42 μm. The colocalization of G6PD and NADK1 was quantified by Manders’ M1/M2 coefficient analysis.
Data are means ± SD of representative result (n = 3). *P < 0.05, **P < 0.01, ***P < 0.001.
