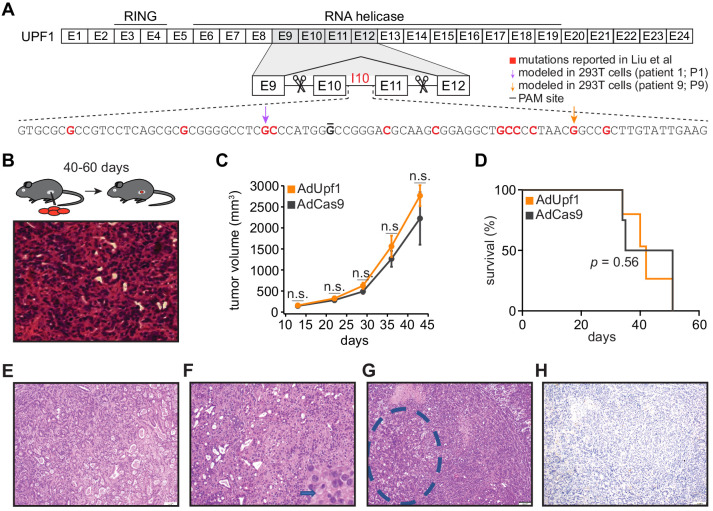
Figure 1. UPF1 mutations do not result in the acquisition of squamous histological features or confer a growth advantage to mutant cells in vivo.
(A) Schematic of UPF1 gene structure and corresponding encoded protein domains. Intron 10 (I10) contains the bulk of the mutations reported by Liu et al. Scissors indicate the sites targeted by the paired guide RNAs used to excise exons 10 and 11 (E10 and E11). Red nucleotides represent positions subject to point mutations reported in Liu et al. Arrows indicate specific mutations that we modeled in 293 T cells. The horizontal black line indicates the nucleotide within the protospacer adjacent motif (PAM) site that we mutated to prevent repeated cutting by Cas9 in 293 T cells. (B) Top, experimental strategy for testing whether mimicking UPF1 mis-splicing by deleting exons 10 and 11 promoted pancreatic cancer growth. Mice were orthotopically injected with mouse pancreatic cancer cells (KPC cells: KrasG12D; Trp53R172H/null; Pdx1-Cre) lacking Upf1 exons 10 and 11. Bottom, hematoxylin and eosin (H and E) stain of pancreatic tumor tissue harvested from the mice. (C) Line graph comparing tumor volume between mice injected with control (AdCas9; Cas9 only) or treatment (AdUpf1; Cas9 with Upf1-targeting guide RNAs) KPC cells. Tumor volume measured by ultrasound imaging. Error bars, standard deviation computed over surviving animals (n = 10 at first time point). n.s., not significant (p>0.05). p-values at each timepoint were calculated relative to the control group with an unpaired, two-tailed t-test. (D) Survival curves for the control (AdCas9) or treatment (AdUpf1) cohorts. Error bars, standard deviation computed over biological replicates (n = 10, each group). p-value was calculated relative to the control group by a logrank test. (E) Representative hematoxylin and eosin (H and E) staining of a pancreatic tumor resulting from orthotopic injection of control KPC cells displaying features of a moderately to poorly differentiated pancreatic ductal adenocarcinoma. Tumors were composed of medium-size duct-like structures and small tubular glands with lower mucin production. (F) Representative H and E image illustrating a moderately to poorly differentiated pancreatic ductal adenocarcinoma resulting from orthotopic injection of Upf1-targeted KPC cells. Depicted here is a section of the poorly differentiated component (arrow), which was characterized by solid sheets of tumor cells with large eosinophilic cytoplasms and marked nuclear polymorphism. (G) Representative H and E image of a pancreatic tumor resulting from orthotopic injection of Upf1-targeted KPC cells. The dashed circle marks a moderately differentiated component; the remainder is poorly differentiated. (H) Representative IHC image of a pancreatic tumor resulting from orthotopic injection of Upf1-targeted KPC cells for the squamous marker p40 (ΔNp63). No expression of the marker was observed in tumor cells.


