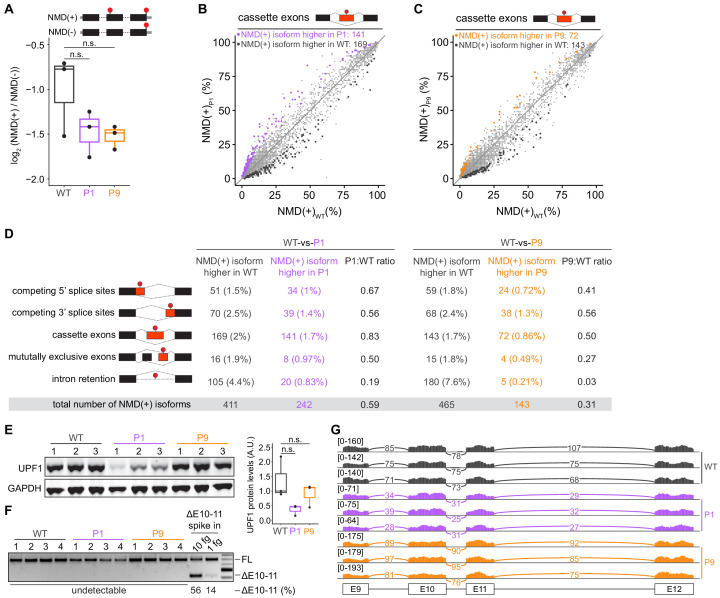
Figure 2. Mutations in UPF1 intron 10 do not inhibit nonsense-mediated mRNA decay (NMD) or cause exon skipping.
(A) Box plot of NMD efficiency in 293 T cells engineered to contain wild-type (WT) or mutant (P1, P9) UPF1. P1 and P9 correspond to the IVS10+31G>A and IVS10-17G>A mutations reported by Liu et al. All cells have the protospacer adjacent motif (PAM) site mutation illustrated in Figure 1A. NMD efficiency estimated via the beta-globin reporter assay11. Middle line, notches, and whiskers indicate median, first and third quartiles, and range of data. Each point corresponds to a single biological replicate. n.s., not significant (p>0.05). p-values were calculated for each variant relative to the control by a two-sided Mann–Whitney U test (p=0.40 for P1, 0.30 for P9). (B) Scatter plot showing transcriptome-wide quantification of transcripts containing NMD-promoting features in 293 T cells carrying the UPF1 mutation that was reportedly observed in patient 1 relative to control, wild-type cells. Each point corresponds to a single isoform that is a predicted NMD substrate (NMD(+)). Purple points represent NMD substrates that are significantly increased in UPF1-mutant cells relative to wild-type cells; black points represent NMD substrates that exhibit the opposite behavior. Plot is restricted to NMD substrates arising from differential inclusion of cassette exons. Significantly increased/decreased NMD substrates were defined as transcripts that displayed either an absolute increase/decrease in isoform ratio of ≥10% or an absolute log fold-change in expression of ≥2 with associated p≤0.05 (two-sided t-test). (C) As (B), but for 293 T cells carrying the UPF1 mutation that was reportedly observed in patient 9. Gold points represent NMD substrates that are significantly increased in UPF1-mutant cells relative to wild-type cells. (D) Summary of the numbers of NMD substrates arising from differential alternative splicing that exhibit significantly higher or lower levels in UPF1-mutant cells relative to wild-type cells. Analysis is identical to (B) and (C), but extended to the illustrated different types of alternative splicing. (E) Left, immunoblot of full-length UPF1 protein for the 293 T cell lines. Each lane represents a single biological replicate with the indicated genotype. GAPDH serves as a loading control. Equal amounts of protein were loaded in each lane (measured by fluorescence). Right, box plot illustrating UPF1 protein levels relative to GAPDH for each genotype. Middle line, notches, and whiskers indicate median, first and third quartiles, and range of data. Each point corresponds to a single biological replicate. Data was quantified with Fiji (v2.0.0). A.U., arbitrary units. n.s., not significant (p>0.05). p-values were calculated for each variant relative to the control by a two-sided Mann–Whitney U test (p=0.10 for P1, 1.0 for P9). (F) PCR using primers that amplify both full-length UPF1 mRNA (FL) and mRNA lacking exons 10 and 11 (ΔE10-11). UPF1 mRNA lacking exons 10 and 11 was only detected in the positive control lanes (ΔE10-11 spike in), in which DNA corresponding to UPF1 cDNA lacking exons 10 and 11 was synthesized and added to cDNA libraries created from WT cells prior to PCR. Numbers above each lane indicate biological replicates. Numbers below each lane represent the abundance of the lower band as a percentage of total intensity (see Materials and methods). Data was quantified with Fiji (v2.0.0). (G) RNA-seq read coverage across the genomic locus containing UPF1 exons 9–12 in the indicated 293 T cell lines. Each sample corresponds to a distinct biological replicate. Numbers represent read counts that supported each indicated splice junction (Katz et al., 2015).


