. 2021 Jan 11;10:e55490. doi: 10.7554/eLife.55490

Figure 5. Inactivation of secondary motor cortex and posterior striatum affects lapses, suggesting a role in action value encoding.

(a) Schematic of cannulae implants in M2 (top) and pStr (bottom) and representative coronal slices. For illustration purposes only, the schematic shows implants in the right hemisphere; however, the inactivations shown in panel (b) were performed unilaterally on both hemispheres. (b) Unilateral inactivation of M2 (top) and pStr (bottom). Left six plots: inactivation of the side associated with low rates shows increased lapses for high rates on visual (blue), auditory (green), and multisensory (red) trials (M2: n = 5 rats; 10,329 control trials, full line; 6174 inactivation trials, dotted line; pStr: n = 5 rats; 10,419 control trials; 6079 inactivation trials). Right six plots: inactivation of the side associated with high rates shows increased lapses for low rates on visual, auditory, and multisensory trials (M2: n = 3 rats; 5678 control trials; 3816 inactivation trials; pStr: n = 6 rats; 11,333 control trials; 6838 inactivation trials). Solid lines are exploration model fits, accounting for inactivation effects across all three modalities by scaling all contralateral values by a single parameter. (c) Increased high-rate lapses following unilateral inactivation of the side associated with low rates (top left); no change in low-rate lapses (bottom left) and vice versa for inactivation of the side associated with high rates (top, bottom right). Control data on the abscissa is plotted against inactivation data on the ordinate. Same animals as in b. Green, auditory trials; blue, visual trials; red, multisensory trials. Abbreviations: posterior striatum (pStr), secondary motor cortex (M2). (d) Sure bet trials are unaffected following inactivation. Pooled data shows that rats that were inactivated on the side associated with high rates make near perfect rightward and leftward choices Top, M2 (three rats); bottom, pStr (six rats). (e) Model comparison of three possible multisensory deficits – reduction of contralateral evidence by a fixed amount (left), reduction of contralateral value by a fixed amount (center), or an increased contralateral effort by a fixed amount (right). Both Akaike Information Criterion and Bayes Information Criterion suggest a value deficit. (f) Proposed computational role of M2 and striatum. Lateralized encoding of left and right action values by right and left M2/pStr (bottom) explains the asymmetric effect of unilateral inactivations on lapses (top).

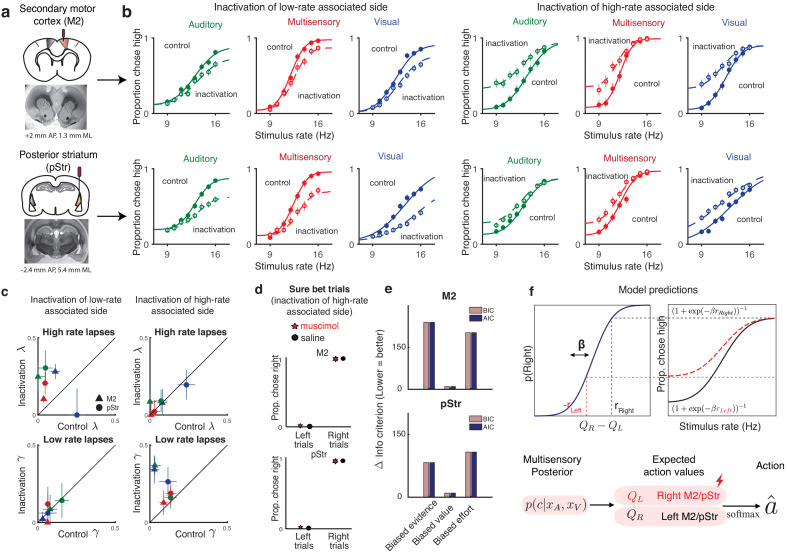
Figure 5.

Figure 5—figure supplement 1. pStr and M2 receive direct projections from visual and auditory cortex.

Figure 5—figure supplement 1.

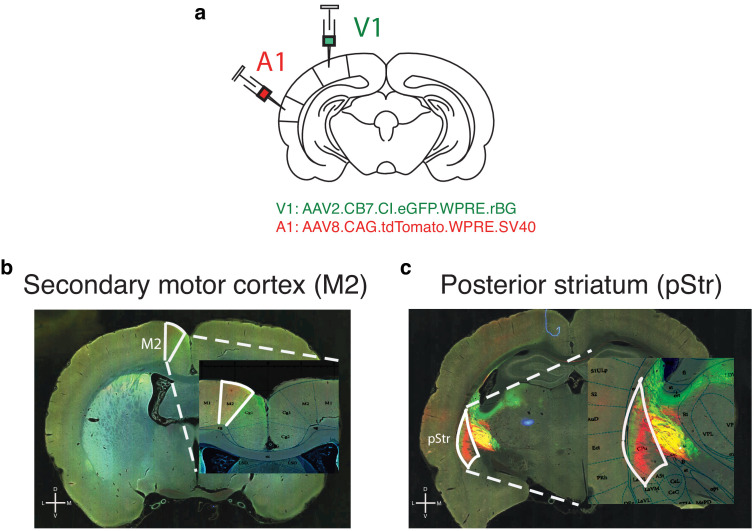
(a) Schematic of tracing experiments. AAV2.CB7.CI.EGFP.WPRE.RBG and AAV2.CAG.tdTomato.WPRE.SV40 constructs were injected unilaterally to primary visual (V1) and auditory (A1) cortices, respectively (V1 coordinates: 6.9 mm posterior to Bregma; 4.2 mm to the right of midline; A1 coordinates: 4.7 mm posterior to Bregma; 7 mm to the right of midline). (b) Secondary motor cortex (M2) receives inputs from V1 and A1 as shown by green and red fluorescence. (c) Posterior striatum (pStr) receives direct inputs from V1 and A1 as shown by green and red fluorescence. Yellow signal medial to pStr reflects overlapping passing fibers.
Figure 5—figure supplement 2. Histological slices of implanted rats.

Figure 5—figure supplement 2.

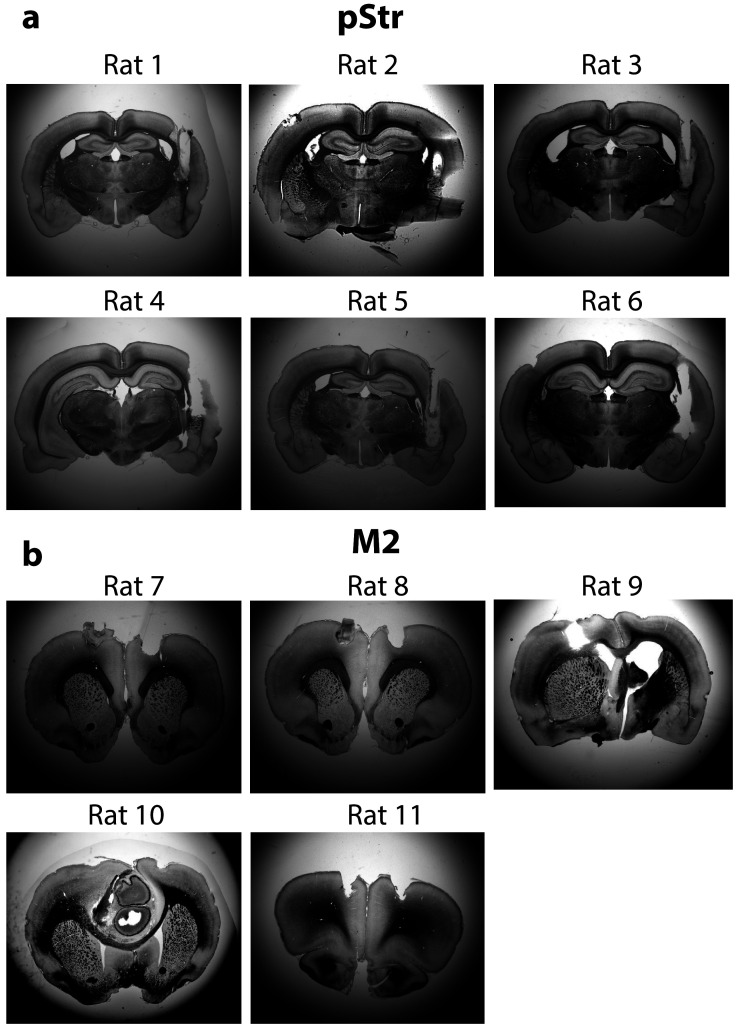
Representative coronal slices of all rats implanted with cannulae for muscimol inactivation experiments. (a) Six rats were bilaterally implanted in posterior striatum (pStr). (b) Five rats were implanted in secondary motor cortex (M2).
Figure 5—figure supplement 3. Single rat performance following M2 inactivation.

Figure 5—figure supplement 3.

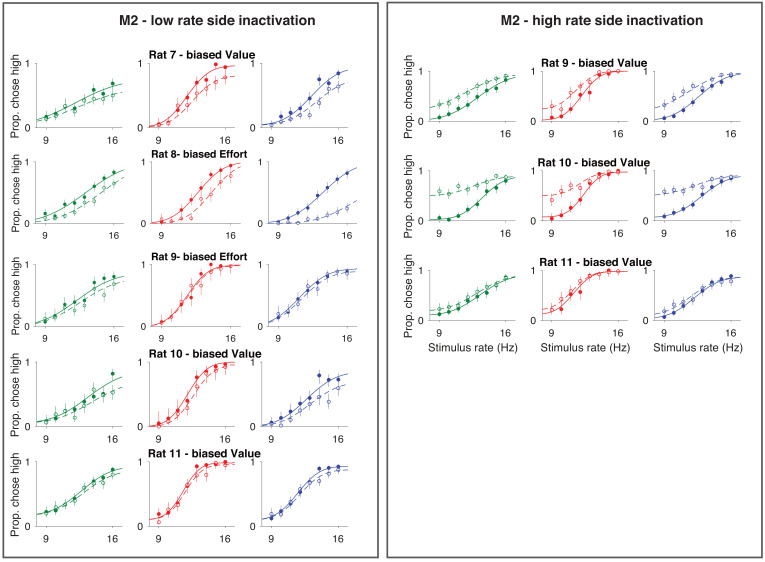
Left: inactivation of the low-rate associated side. Rat shows increased lapses on high-rate trials on all sensory modalities. Right: inactivation of the high-rate associated side. Rat shows increased lapses on low-rate trials on all sensory modalities. Auditory (green), visual (blue), and multisensory (red).
Figure 5—figure supplement 4. Single rat performance following pStr inactivation.

Figure 5—figure supplement 4.

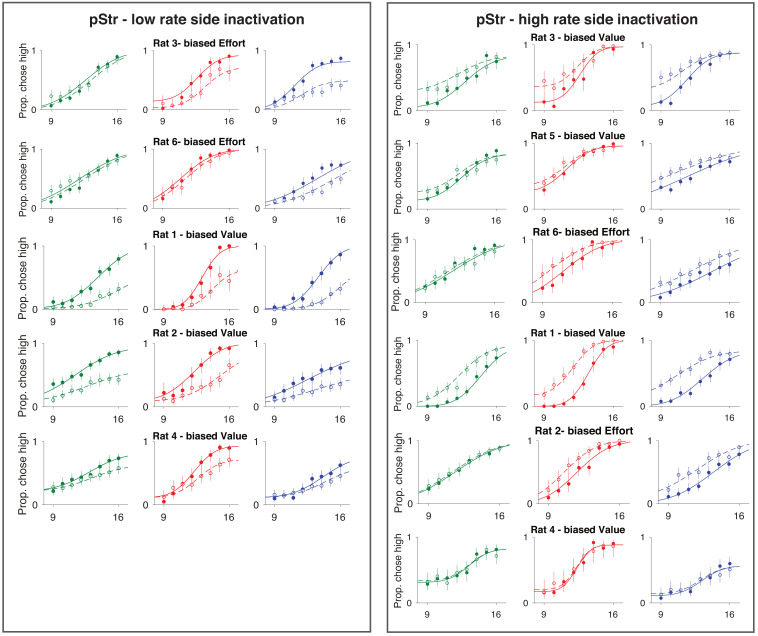
Left: inactivation of the low-rate associated side. Rat shows increased lapses on high-rate trials on all sensory modalities. Right: inactivation of the high-rate associated side. Rat shows increased lapses on low-rate trials on all sensory modalities. Auditory (green), visual (blue), and multisensory (red).
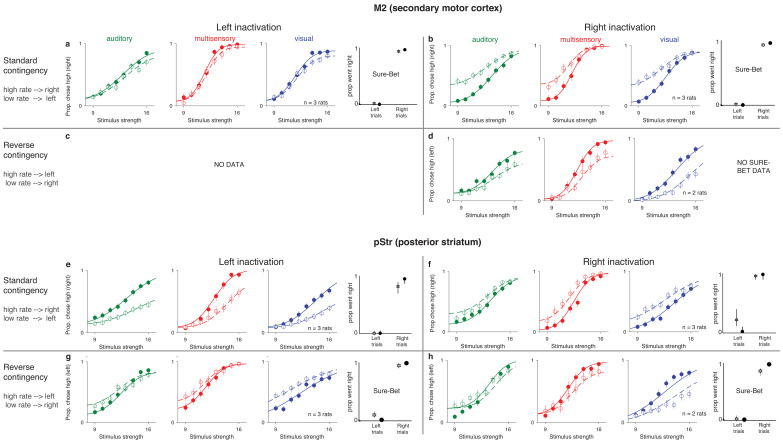
Figure 5—figure supplement 5. Unilateral inactivation of M2 or pStr biases performance ipsilaterally and increases contralateral lapses.

Figure 5—figure supplement 5.

Performance of the same rats shown in Figure 5b depicted as a function of the inactivated side (right or left) and the rate-contingency in which they were trained (standard or reverse), along with fits from the biased value model (solid lines – saline, dotted lines - muscimol). Standard contingency: high rate = go right, low rate = go left; reverse contingency: high rate = go left, low rate = go right. Each quadrant shows four plots: three psychometrics for rate discrimination trials and one for performance on sure-bet trials. auditory (green), visual (blue), and multisensory (red). (a–d) M2 inactivation. (e–h) pStr inactivation. (a), (d) Rats trained on the standard contingency and inactivated on the left hemisphere show increased lapses on the high rates (i.e., fewer rightward choices on high rates). No effect on sure-bet trials. (b), (f) Rats trained on the standard contingency and inactivated on the right hemisphere show increased lapses on the low rates (i.e., fewer leftward choices on low rates). No effect on sure-bet trials. (c), (g) Rats trained on the reverse contingency and inactivated on the left hemisphere show increased lapses on the low rates (i.e., fewer rightward choices on low rates). No effect on sure-bet trials. No data for this condition for M2 inactivation. (d), (h) Rats trained on the reverse contingency and inactivated on the right hemisphere show increased lapses on the high rates (i.e., fewer leftward choices on high rates). No effect on sure-bet trials for pStr inactivated animals; no data for M2 inactivated animals.
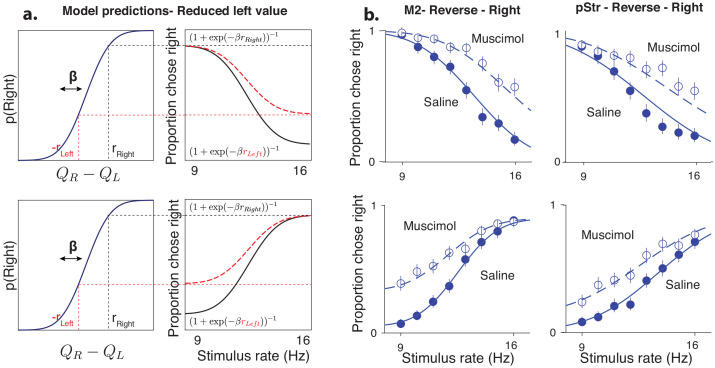
Figure 5—figure supplement 6. Inactivations devalue contralateral actions irrespective of associated stimulus.

Figure 5—figure supplement 6.

(a) Model predictions for rightward inactivations on standard (top) and reversed (bottom) stimulus-response contingencies – in both cases, the model predicts that reduced leftward action values should only affect lapses on the side associated with leftward movements. (b) Inactivation data on visual trials from M2 (left) or pStr (right) along with fits from the biased value model (solid lines – saline, dotted lines – muscimol) shows a pattern of effects consistent with action value deficits, irrespective of the contingency.
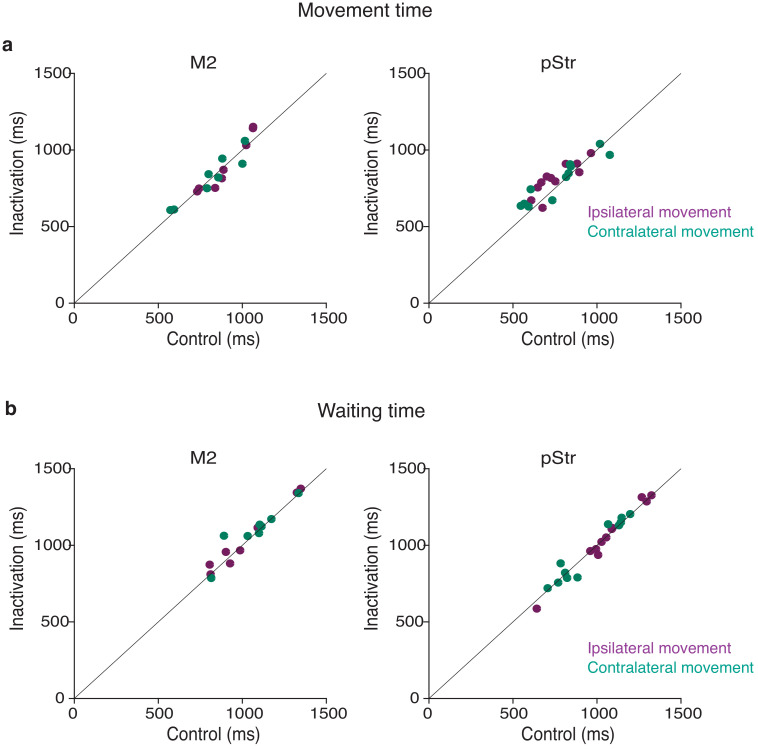
Figure 5—figure supplement 7. No significant effect on movement parameters following muscimol inactivation.

Figure 5—figure supplement 7.

(a) Mean movement times from the center port to the side ports were not significantly different following muscimol inactivation of M2 (left; p=0.9554 for contralateral, 0.9852 for ipsilateral movements; n = 5 rats) or pStr (right; p=0.6629 for contra, p=0.2615 for ipsi, n = 6 rats). Control data on the abscissa is plotted against inactivation data on the ordinate. Purple, movement toward the side ipsilateral to the inactivation site; blue, movement toward the side contralateral to the inactivation site; error bars (s.e.m.) are not visible because they were obscured by the markers in all cases. (b) Mean wait times in the center port were not significantly different following muscimol inactivation of M2 (left; p=0.7612 for contra, p=0.8896 for ipsi, n = 5 rats) or pStr (right; p=0.9128 for contra, p=0.9412 for ipsi, n = 6 rats). All p-values were computed from paired t-tests. Error bars (s.e.m.) are not visible because they were obscured by the markers in all cases.