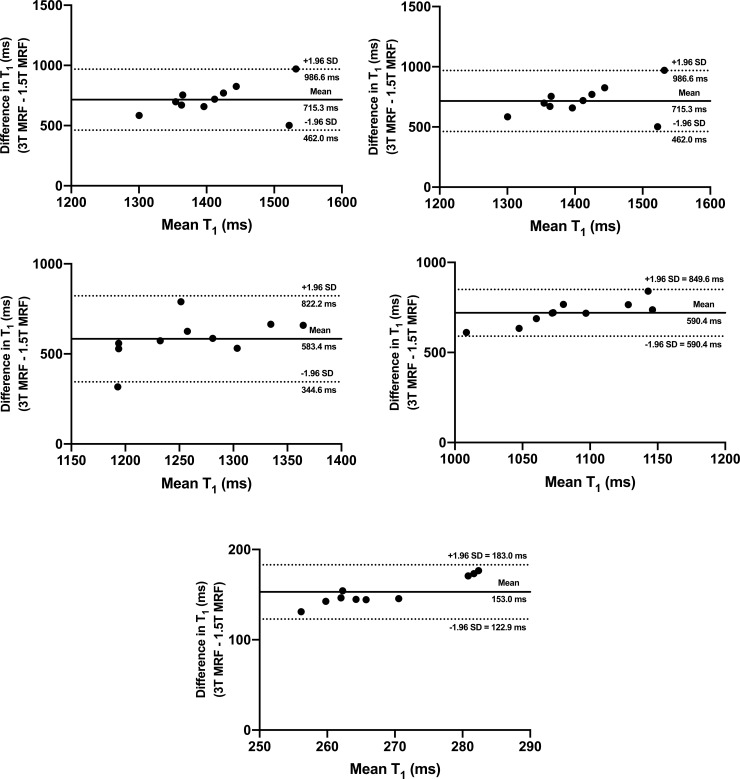
Fig 4.
Bland-Altman plots comparing in vivo MRF T1 values obtained from the whole prostate (a), peripheral zone (b), transition zone (c), internal obturator muscle (d) and fat in the ischioanal fossa (e) at 1.5T and 3T systems. Dotted lines represent upper and lower 95% limits of agreement and bold lines represent the mean biases with appropriate captions included. MRF = magnetic resonance fingerprinting, SD = standard deviation.

