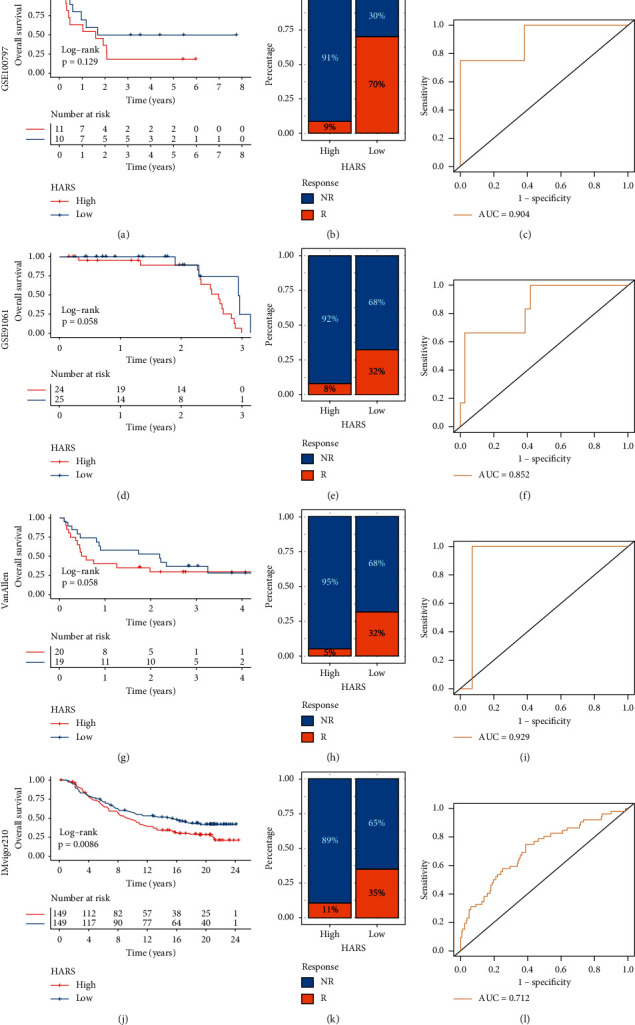
Figure 10.

The performance of HARS for predicting the immunotherapy response. (a–c) The Kaplan–Meier analysis (a), immunotherapy response ratio (b), and ROC curve (c) of HARS in GSE100797 cohort. (d–f) The Kaplan–Meier analysis (d), immunotherapy response ratio (e), and ROC curve (f) of HARS in GSE91061 cohort. (g-i) The Kaplan–Meier analysis (g), immunotherapy response ratio (h), and ROC curve (i) of HARS in VanAllen cohort. (j–l) The Kaplan–Meier analysis (j), immunotherapy response ratio (k), and ROC curve (l) of HARS in IMvigor210 cohort.
