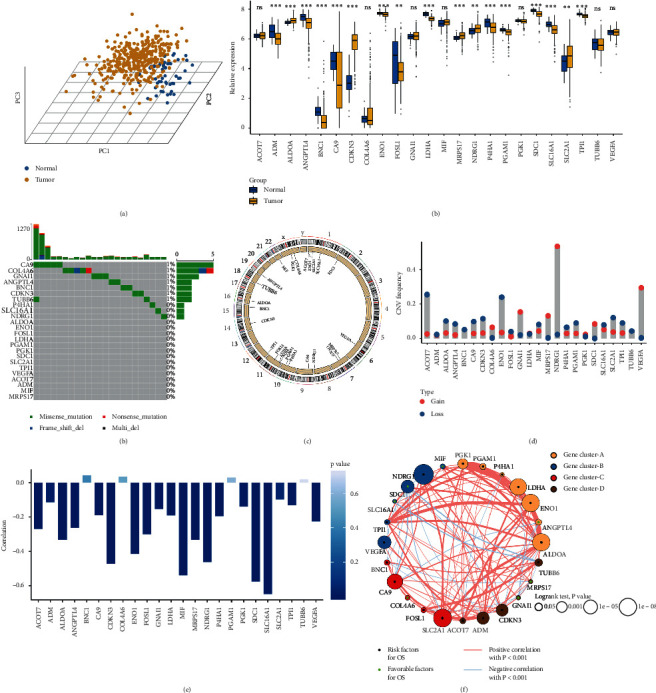
Figure 2.

Landscape of genomic variations in hypoxia-associated molecules in TCGA-LIHC cohort. (a) Principal component analysis for the expression profiles of 24 hypoxia-associated genes (HAGs) to distinguish tumors from normal samples in TCGA-LIHC cohort. Tumor group is marked with yellow, and normal group is marked with blue. (b) The expression of 24 HAGs between normal and tumor groups. Normal, blue; tumor, yellow. ns, P > 0.05; ∗P < 0.05; ∗∗P < 0.01; ∗∗∗P < 0.001. (c) The mutation frequency of 24 HAGs. Each column represented individual patients. The upper bar plot showed TMB. The number on the right indicated the mutation frequency in each gene. The right bar plot showed the proportion of each variant type. (d) The location of copy number alteration (CNA) of HAGs on 23 chromosomes. (e) The CNA frequency of HAGs. The height of the column represented the alteration frequency. The loss frequency, blue dot; the gain frequency, red dot. (f) The correlation between methylation and expression of HAGs. (g) The interaction among 24 HAGs in HCC. The circle size represented the effect of each gene on the prognosis, and the range of values was calculated by the log-rank test was P < 1e − 8, P < 1e − 5, P < 0.001, and P < 0.05, respectively. Green dots in the circle, protective factors of prognosis; black dots in the circle, risk factors of prognosis. The lines linking regulators showed their interactions, and thickness showed the correlation strength between regulators. Negative correlation was marked with blue and positive correlation with red. The gene cluster A-D was marked with yellow, blue, red, and brown, respectively.
