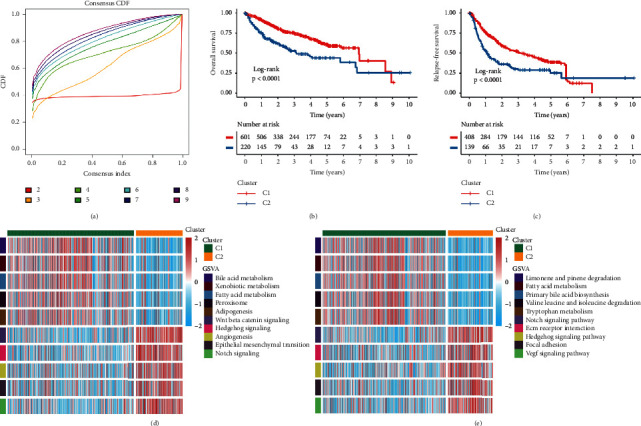
Figure 3.

The prognostic significance and functional annotation of hypoxia subtypes in metacohort. (a) The CDF of consensus matrix for each k (indicated by colors). The lowest and flattest curve indicated the optimal k (k = 2). (b) Kaplan–Meier curves of OS for the two subtypes in metacohort. Log-rank test showed the P < 0.001. (c) Kaplan–Meier curves of RFS for the two subtypes in metacohort. Log-rank test showed the P < 0.001. (d) The activation of specific Hallmark pathways between the two subtypes. (e) The activation of specific KEGG pathways between the two subtypes.
